



The Nasdaq 100 rebounded on Friday from the key support zone as the chip stocks got relief after the strong selloff in technology stocks. But the index closed the week with loss of 4.92% and still remains under pressure. The results of US midterm elections increased concerns that the tight rules may slow the expansion of AI data centers. The strong jobs data in the US increased expectations of rate hikes by the Fed. But renewed trade tensions between the US and China put pressure on technology stocks.
Chip Stocks Rebound After the US Midterm Sell-Off
The Nasdaq 100 rebounded on Friday after hitting the strong key support level but closed the week in negative territory with 4.92% loss. The rebound on Friday developed as buyers returned to semiconductor stocks.
Many Democrats campaigned on promise to rein in AI data center expansion, which voters fear will drive up electricity costs and use up scarce water resources. Their sweep of the House and Senate will likely slow the AI buildout, with implications for semiconductors and heavy industry. This triggered a strong drop in technology and semiconductor stocks which pushed the S&P 500 and Nasdaq 100 to lower levels.
I think that the rebound on Friday needs further support from chipmakers before this rebound signals a strong recovery. The market needs confidence that AI spending will produce strong profits in the future.
Nasdaq 100 Rebound Faces Rate Hike and Inflation Risks
Strong US Jobs Report Lifts December Fed Rate Hike Bets
The US jobs data also provide complicated outlook for the US stock market. The chart below shows that employers added 165,000 jobs in October which is higher than 60,000 in September.
NASDAQ 100 Price Forecast
Every new NASDAQ 100 analysis as it publishes, today's technical signal and key levels, live price — on one page.
See all NASDAQ 100 forecasts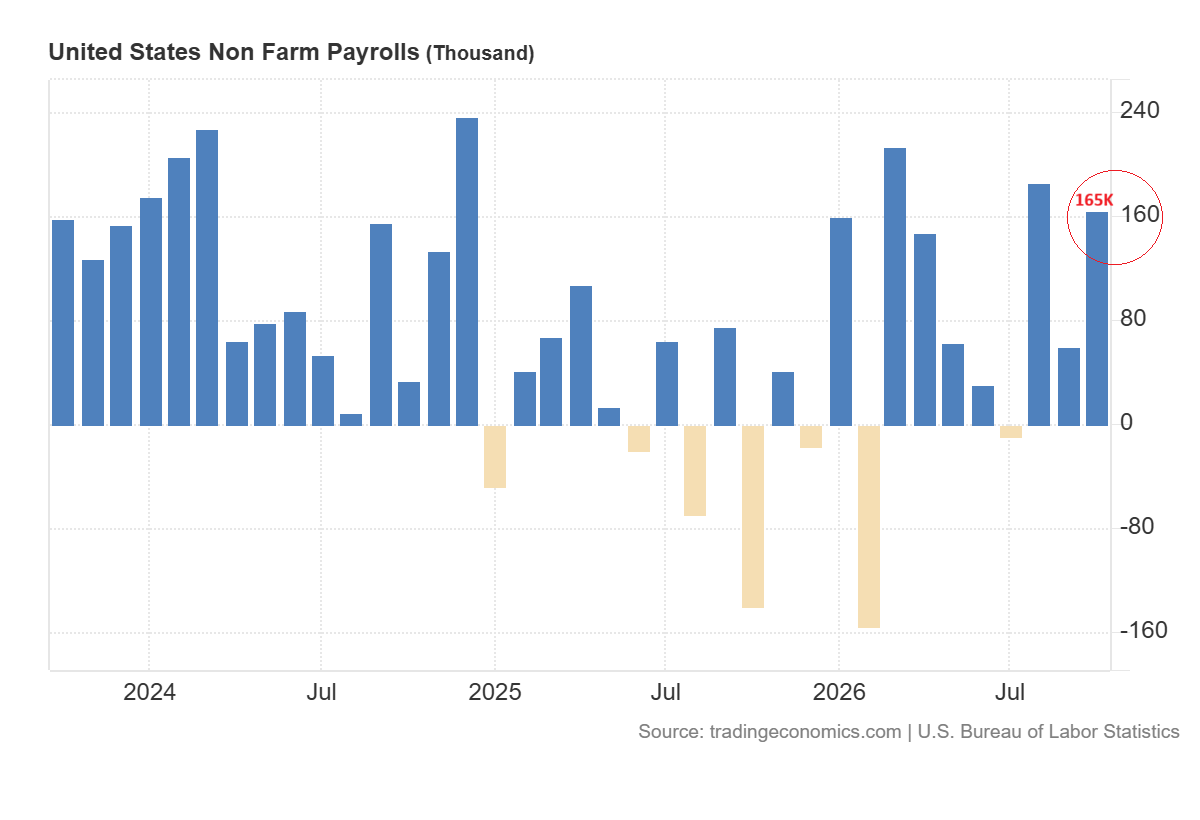
The unemployment rate dropped to 4.1% and average hourly earnings increased by 0.4% from September.
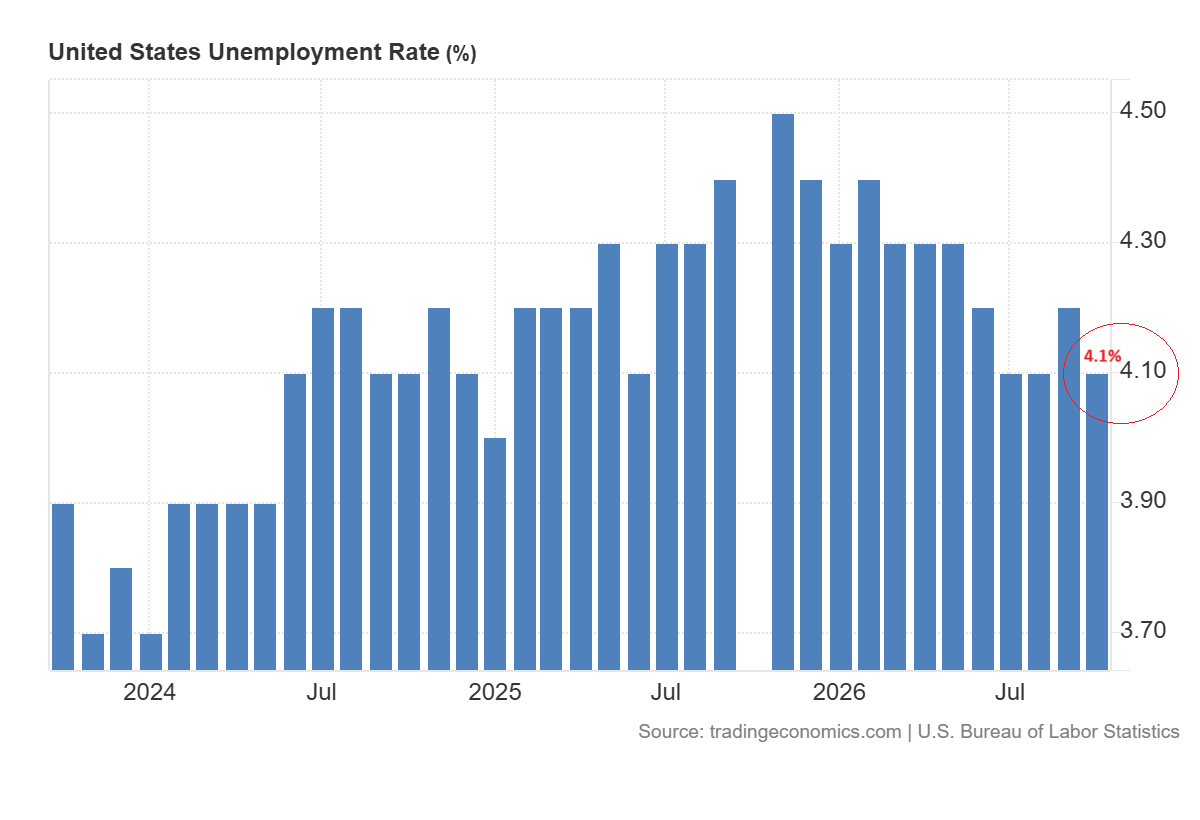
The expectations of a Fed rate hike in December increased to 78% after the release of the US jobs data. The strong jobs data support consumer spending but higher interest rates can put pressure on technology stocks by reducing the present value of future profits.
These data suggest that if semiconductor stocks continue to rebound from the support areas, they may continue to support recovery in the Nasdaq index. But if there is renewed inflation pressure due to the rise in oil prices, it may limit further rallies and continue to pressure Nasdaq index.
Financial Conditions Tighten and ISM Input Costs Stay High
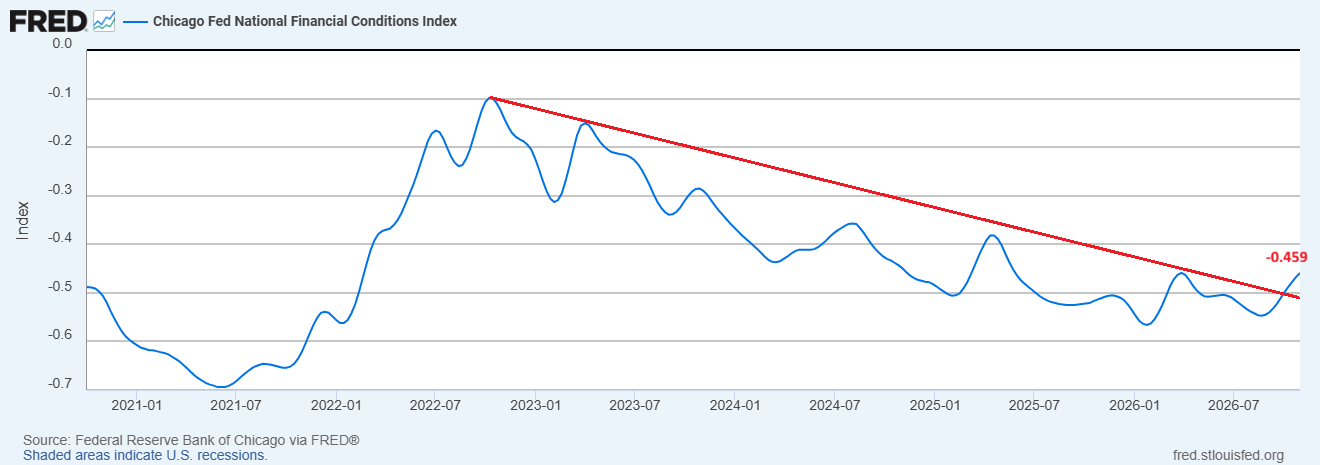
The chart below shows that the Chicago Fed National Financial Conditions Index increased to −0.459 on October 30. The index has now reached the highs of March 2026. A break above the highs of March 2026 will likely indicate a positive trend. This will suggest tightening of liquidity in financial markets.
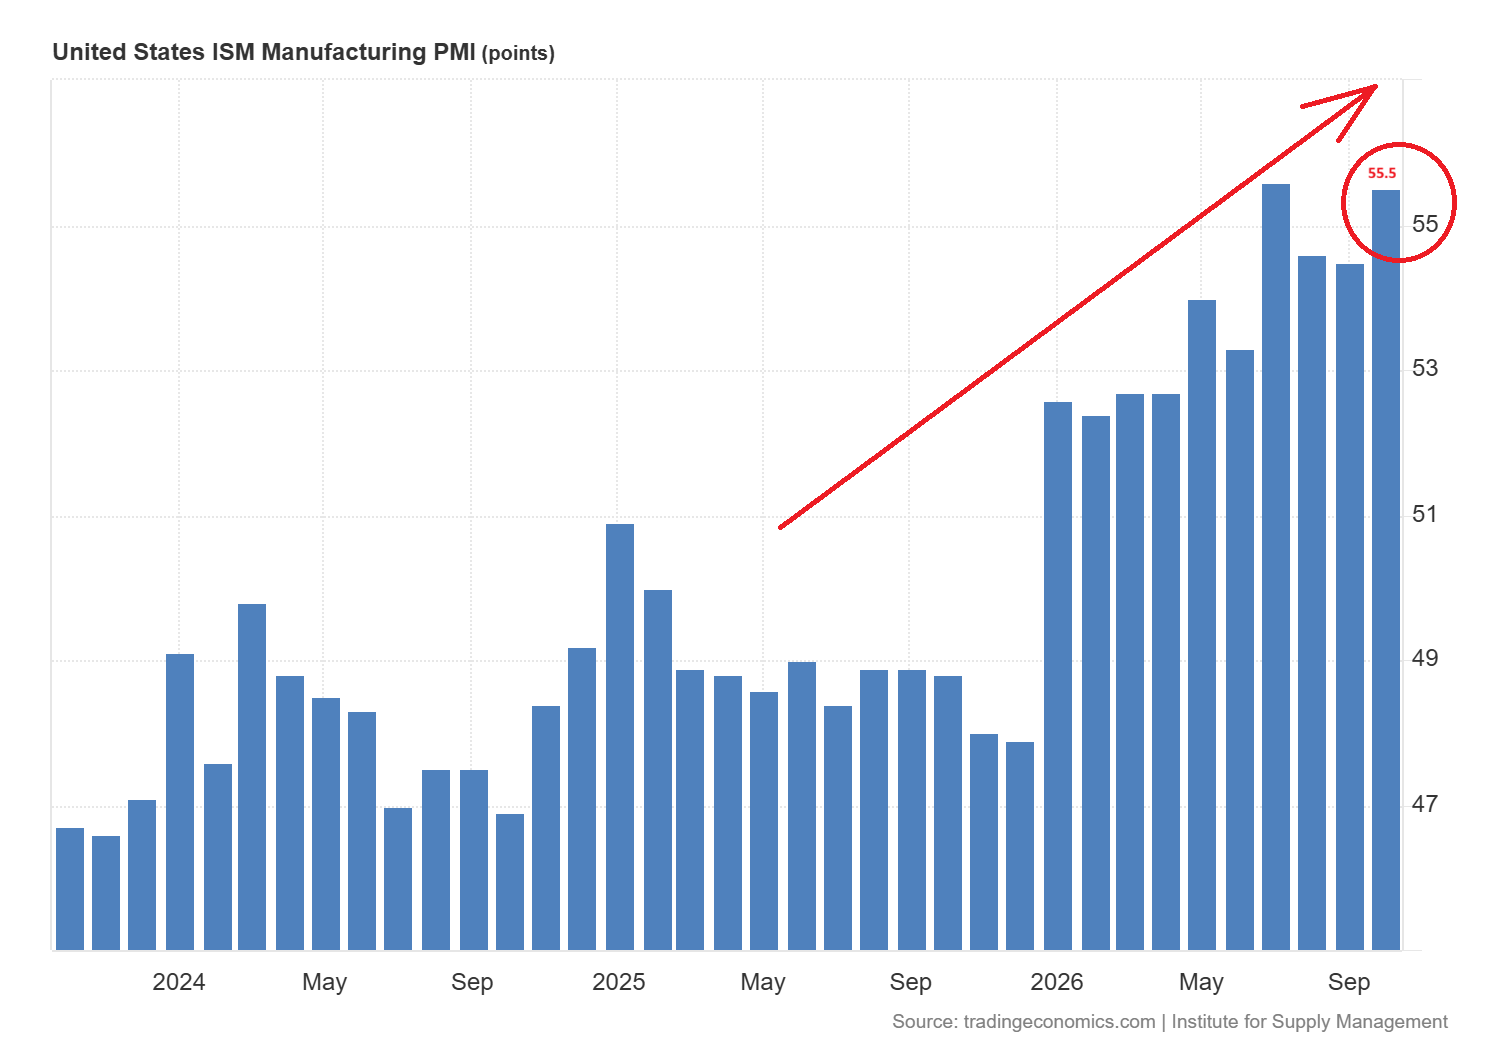
The chart below shows that the ISM Manufacturing PMI has increased to the 55.5 level, which reflects increased demand from AI expansion.
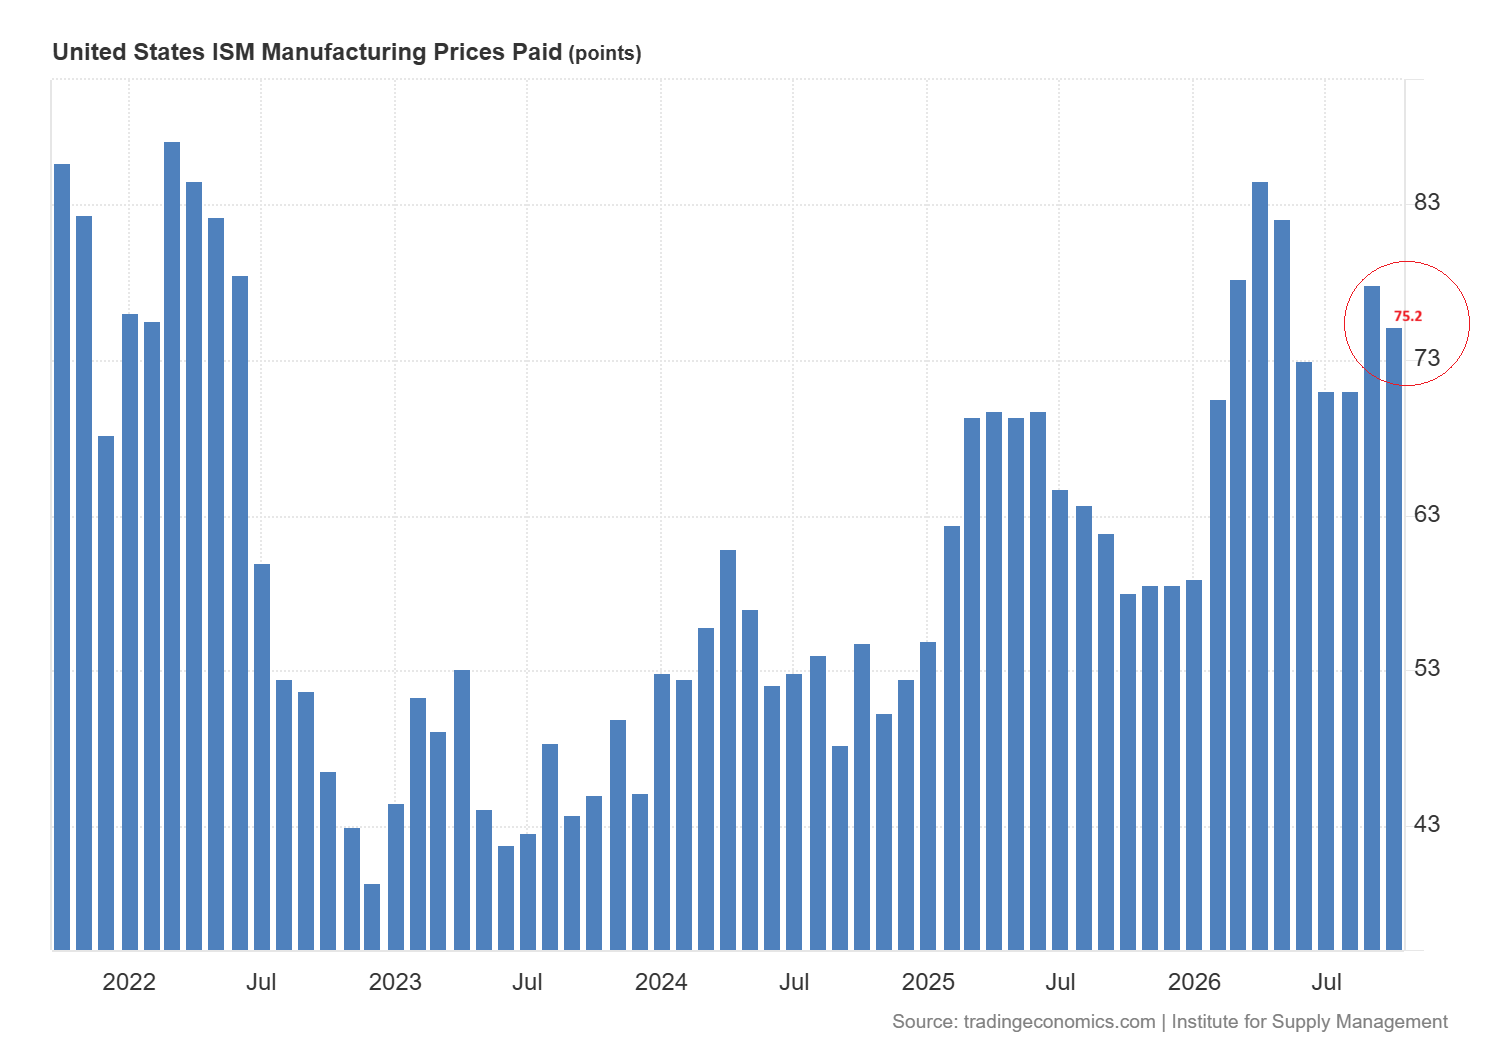
Moreover, the ISM Manufacturing Prices Paid Index was 75.2 which also remains high. The data suggests that there is a strong uptrend in producer prices that may be passed on to consumers.
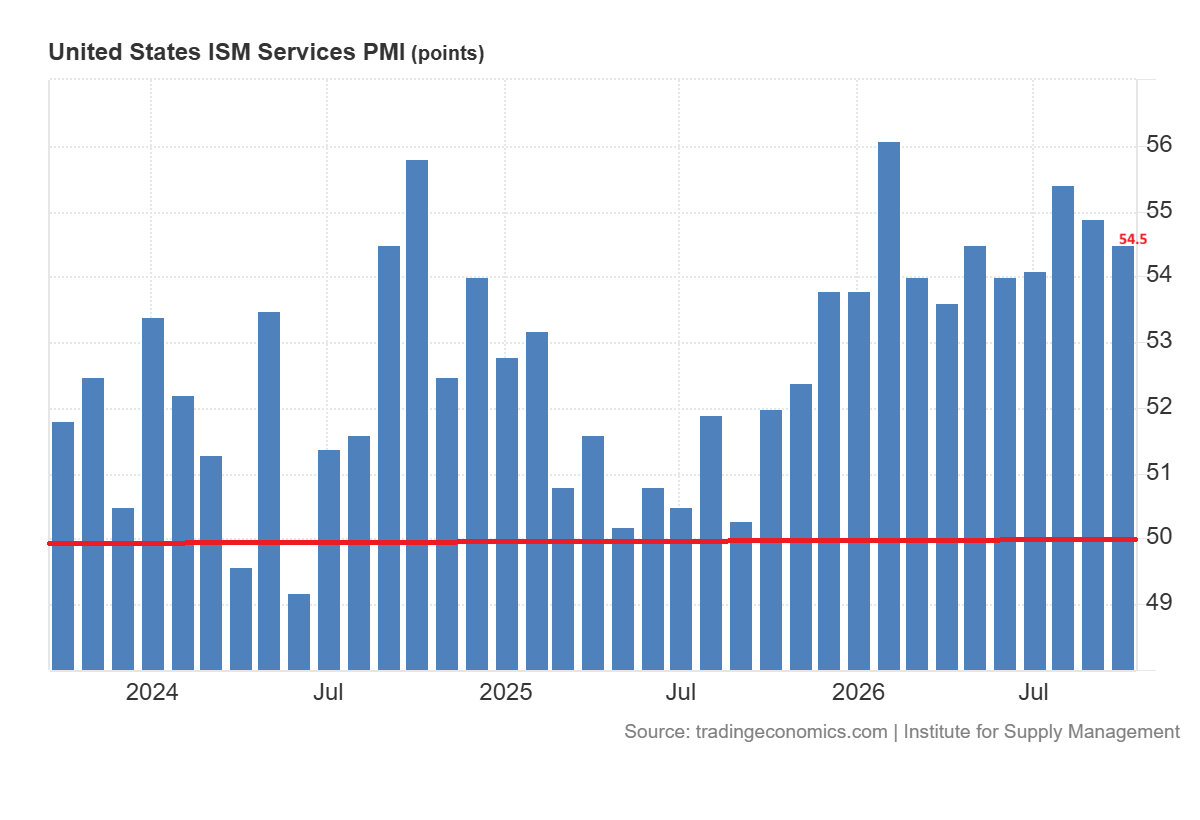
The ISM Services PMI has remained strong and has continued to rally since 2024, which suggests continued expansion.
Trump Tariffs and US-China Trade Tensions Add to Tech Risks
The tensions between the U.S. and China have returned this week as Trump administration urged Beijing to fulfil the trade commitments. These include deliveries of rare earths and other critical minerals as well as purchases of U.S. farm goods.
These tensions are important for Nasdaq because technology manufacturers are dependent on reliable supplies of materials and components. If tariffs continue to increase and export controls remain tight, they may increase cost of production and delay deliveries.
Companies may pass these costs to customers by raising prices. I think that any progress in these talks may support technology stocks but renewed retaliation would add pressure to the already fragile recovery.
There is also pressure to reverse Trump tariffs on Canada. Prime Minister Mark Carney welcomed the Democrats’ push to repeal the duties after their midterm victory. Senator Ron Wyden has identified Canadian tariffs as early target when Democrats take control of Congress in January.
Nasdaq 100 Technical Outlook: 26,200 Support Under Pressure
Nasdaq 100 Weekly Outlook: 26,200 Support Under Pressure
The weekly chart for the Nasdaq index shows that the Nasdaq produced a fake breakout above the 30,600 level in October and triggered strong drop to reach the long-term support at 26,200. The Nasdaq index took only four weeks to hit the support. This suggests that the momentum in the Nasdaq 100 remains strongly bearish and therefore a break below 26,200 may open the way for stronger drop toward the 23,000 area.
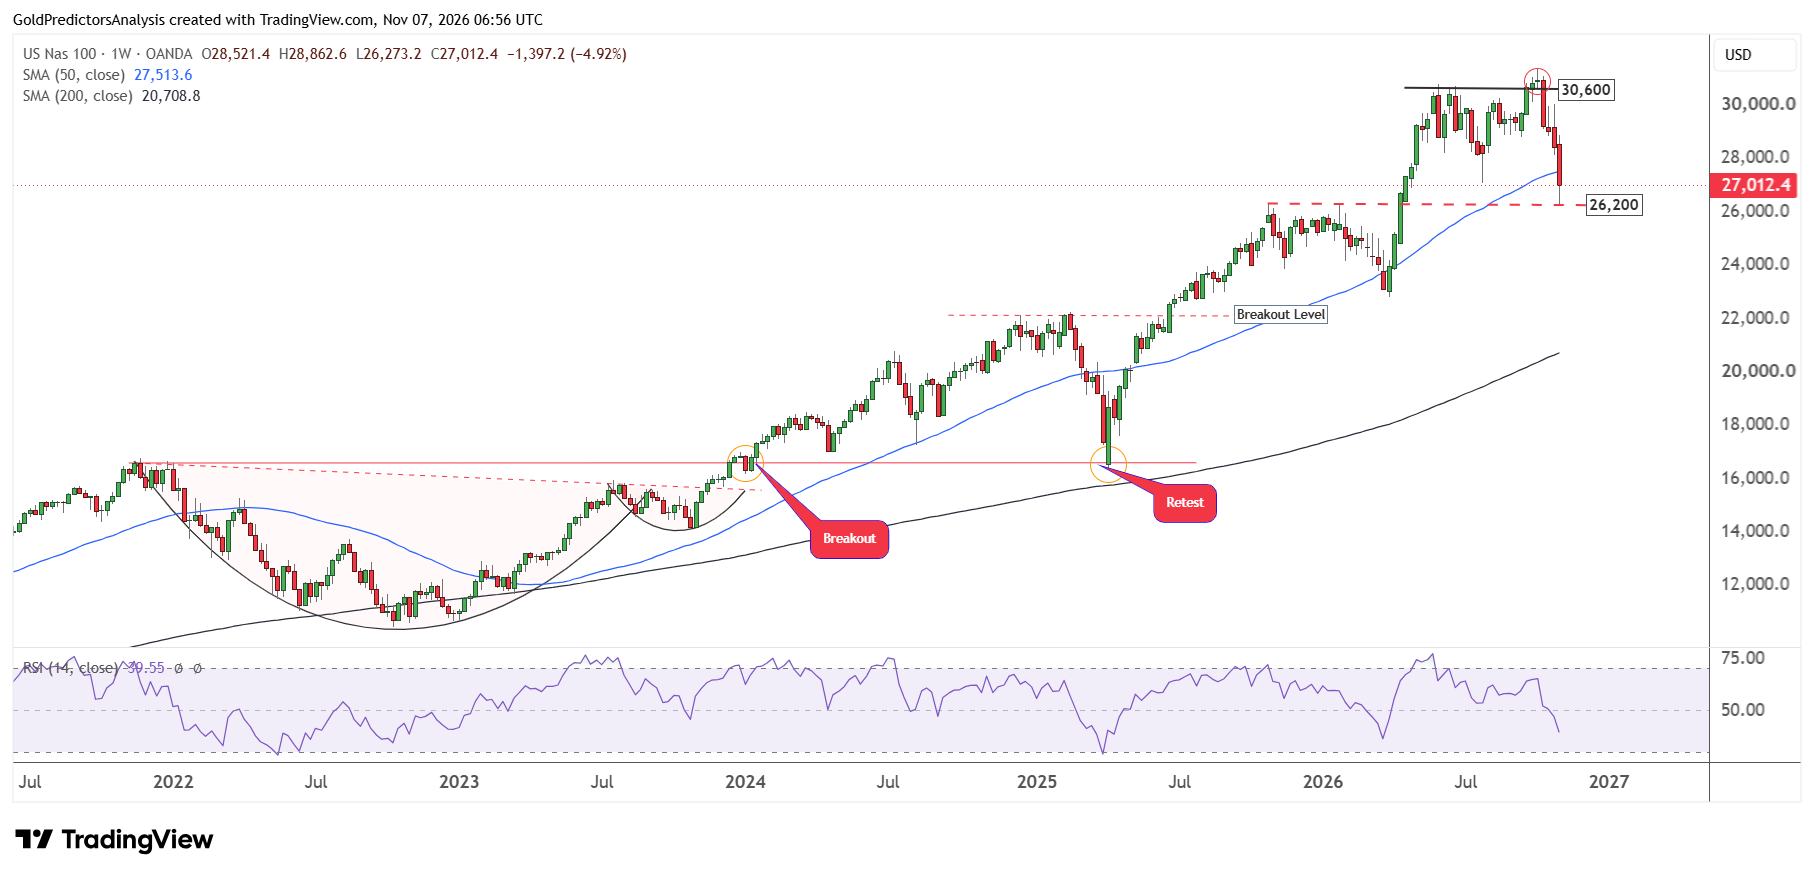
Despite this strong correction from the record highs the overall structure for the Nasdaq 100 remains strongly bullish. This bullish structure is seen in the cup and handle formation from November 2021 to January 2024.
A break above the neckline of the cup and handle formation near the 16,800 level has triggered strong surge.
Now the Nasdaq 100 has closed below the 50-week SMA and reached 26,200. This suggests that the index may try to form a bottom during the next few days to trigger another rally. However, the RSI still remains near the 39.55 level. The RSI must recover above the midline to suggest a positive movement in the Nasdaq 100.
Nasdaq 100 Daily Outlook: 28,000 Is the Next Test
The daily chart for the Nasdaq 100 shows that the index has hit the strong pivotal support area. The ascending broadening wedge pattern defines this support which stretches from June 2025.
The support at 26,200 is also defined by the highs of October 2025. A break below this level will likely open the way for further drop toward the support zone of 23,000-24,000. The neckline of inverted head and shoulders defines this area. This pattern was formed from December 2024 to June 2025.
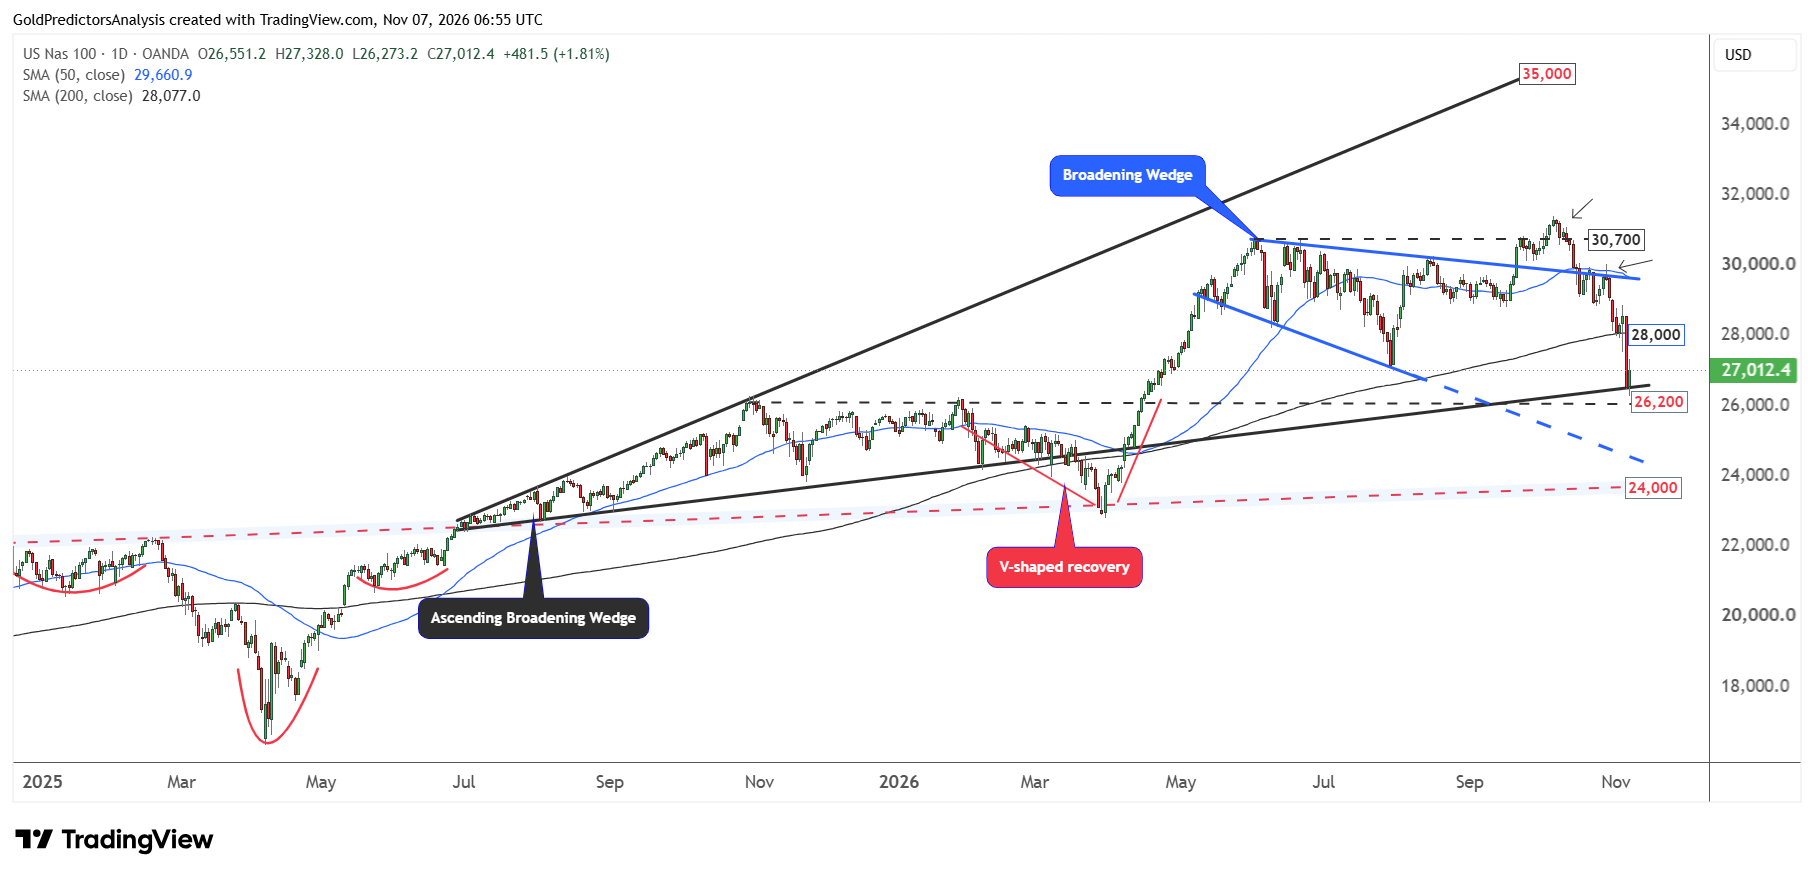
The Nasdaq 100 presents two important key support zones. One support zone is the 24,000 region and the second is the 26,200 region. These two support zones will likely attract investors. The index must recover above 200-day SMA near the 28,000 level to initiate another rally toward the 50-day SMA near 29,600.
A confirmed break above 29,600 will suggest that the bottom is confirmed and will open the way for further upside towards 35,000.
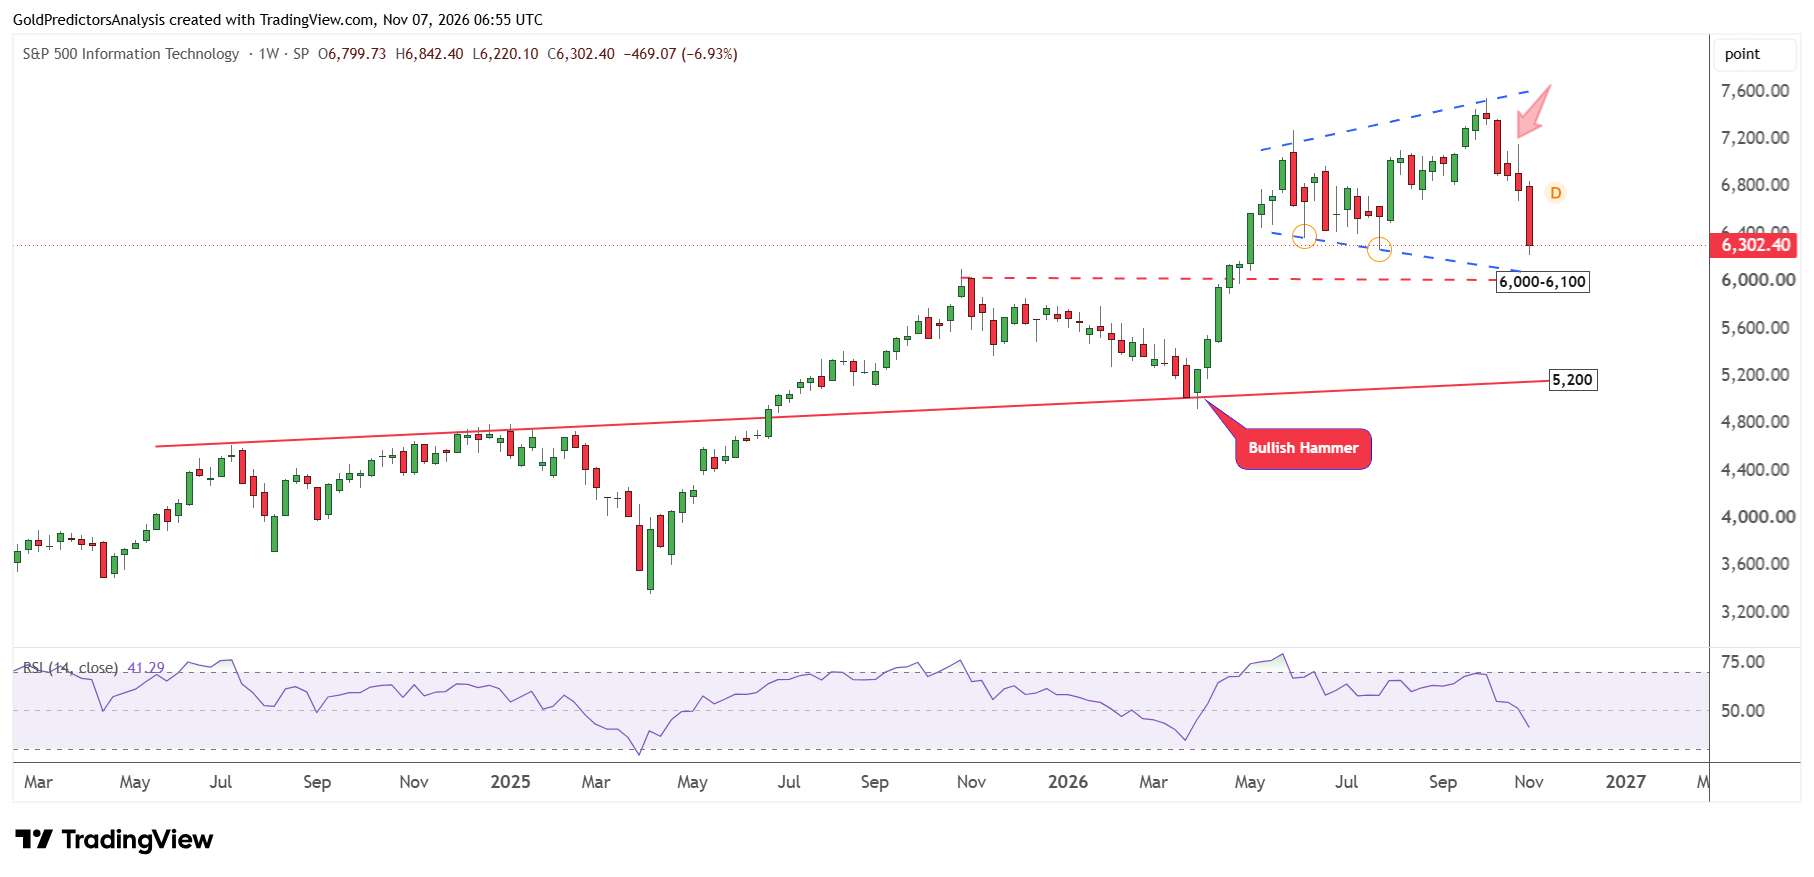
S&P 500 Information Technology Index Nears Support at 6,000–6,100
The strong support in the technology sector is also observed in the weekly chart for the S&P 500 Information Technology Index. The index lost nearly 6.93% for the week and continues to drop toward the major support of 6000-6,100. This support is considered major support.
The symmetrical broadening wedge pattern defines this support. This pattern was formed from the highs of June 2026. A break below 6,000 will likely push the technology stock further downside. But a recovery above 6,800 will suggest positive movement.
What to Watch Next for the Nasdaq 100
Technology stocks still remain under pressure and continue to drop. The rebound on Friday still needs confirmation from the key resistance areas. The Nasdaq 100 index and the Philadelphia Semiconductor Index also signal a primary downtrend.
Brent crude oil has hit the key support area and is still rebounding from the support zone. A peace deal between the US and Iran is still a long way off. Until a peace deal is reached, oil prices may rebound further from support. Higher oil prices may increase inflationary pressure and drive up long-term Treasury yields, which would be a bearish signal for stocks. The Federal Reserve may continue to keep interest rates high, which would also be a bearish signal for stocks.
From a technical perspective, I think that the Nasdaq 100 has hit the key support level of 26,200. A break below this level will likely open the way for a further drop towards the 24,000 area. However, 26,200 is considered a major support level. A rebound may develop towards the 28,000 level. The index needs to close above the 28,000 level to signal a stronger recovery. But a break below 26,200 may open the way for a further drop towards the long-term support area of 23,000 to 24,000.
Read more: AI Selloff Puts 28,000 Support at Risk