



The major U.S. stock indexes are getting hit hard at the mid-session on the first trading day of the month. The sell-off was primary driven by a steep drop in defense-related companies, probably in reaction to the softening of the tone in the Korean Peninsula. Investors were also squaring positions ahead of the release of quarterly earnings from Apple.
In the cash market at 1705 GMT, the benchmark S&P 500 Index is trading 2631.39, down 16.66 or -0.63%. The blue chip Dow Jones Industrial Average is trading 23869.31, down 293.84 or -1.22% and the tech-driven NASDAQ Composite is at 7056.15, down 10.12 or -0.14%.
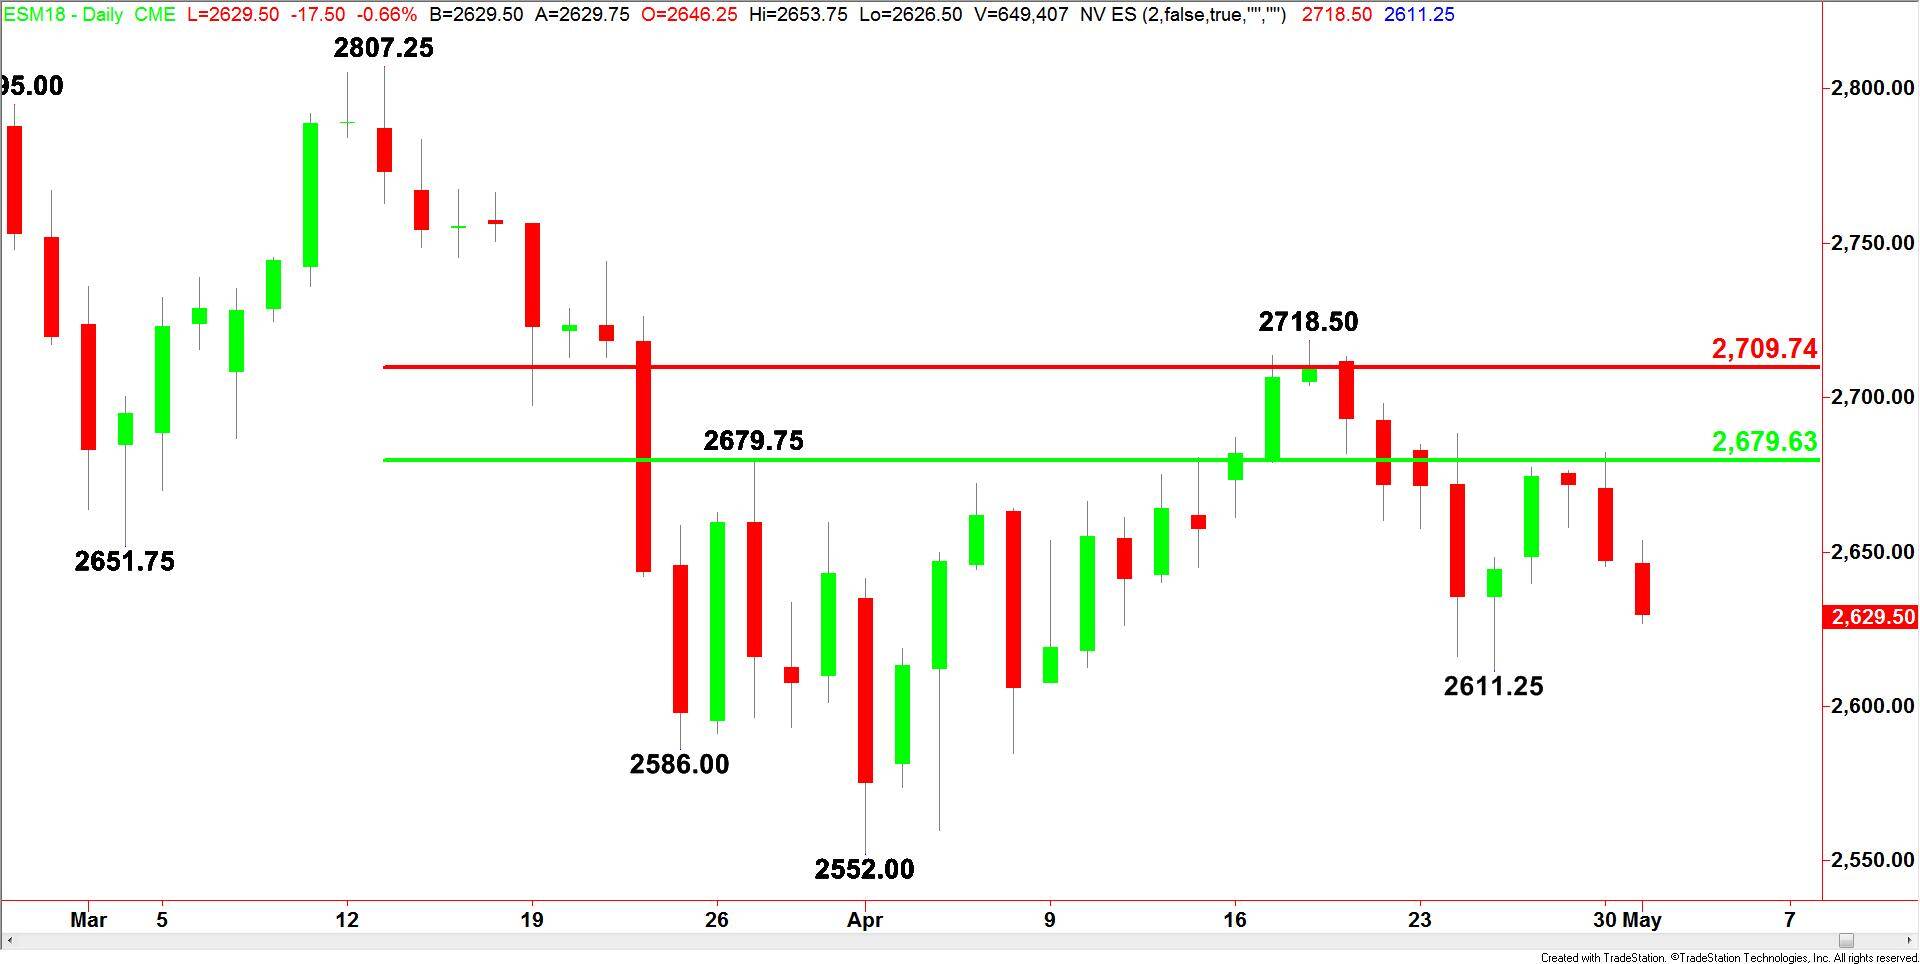
A 1.5 percent drop in shares of Boeing is driving down the Dow. The S&P 500 Index is being driven lower by more than 1 percent declines in energy, materials and industrials.
The iShares U.S. Aerospace & Defense ETF (ITA) dropped 2 percent. The fund was also on track to post its first six-day losing streak since November 2017. Steel stocks also declined sharply, with the VanEck Vectors Steel ETF (SLX) falling 2.4 percent. The drop in steel stocks was likely tied to President Trump extending the waiting period on the steel tariffs he had proposed nearly two months ago.
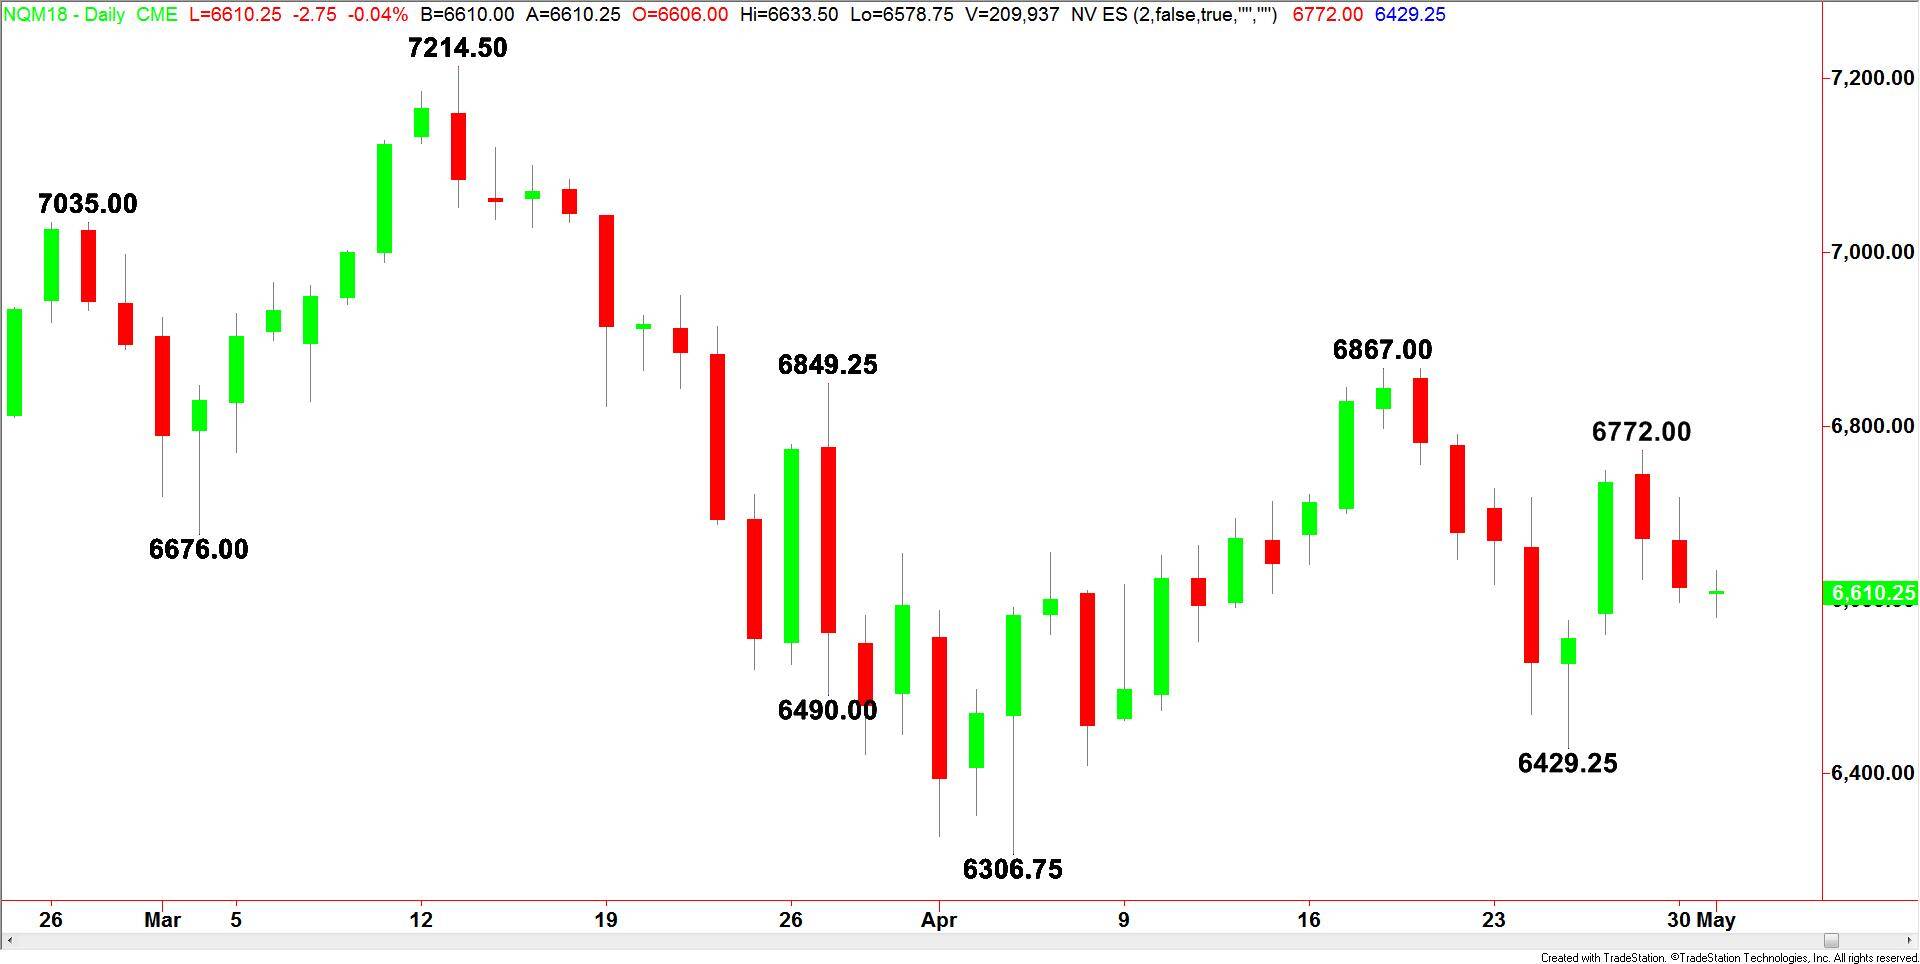
In economic news, the ISM manufacturing index hit 57.3 in April. Home prices surged 7 percent higher in March compared with a year ago, making the gain the biggest since May 2014. Construction spending came in below expectations at -1.7%.
We’re looking for volatility into the close as investors position themselves ahead of the release of Apple’s fiscal second quarter earnings and revenue report after the close. Apple is the largest publicly traded company in the U.S., with a market cap of nearly $850 billion.