


The benchmark S&P 500 Index finished lower for a second straight week last week as nervous investors booked profits on concerns over corporate spending and rising global inflation.
Weakness in the technology sector was the primary driver of the market’s decline. Investors were especially rattled by the massive amounts of money major hyperscalers are pouring into artificial intelligence (AI) infrastructure.
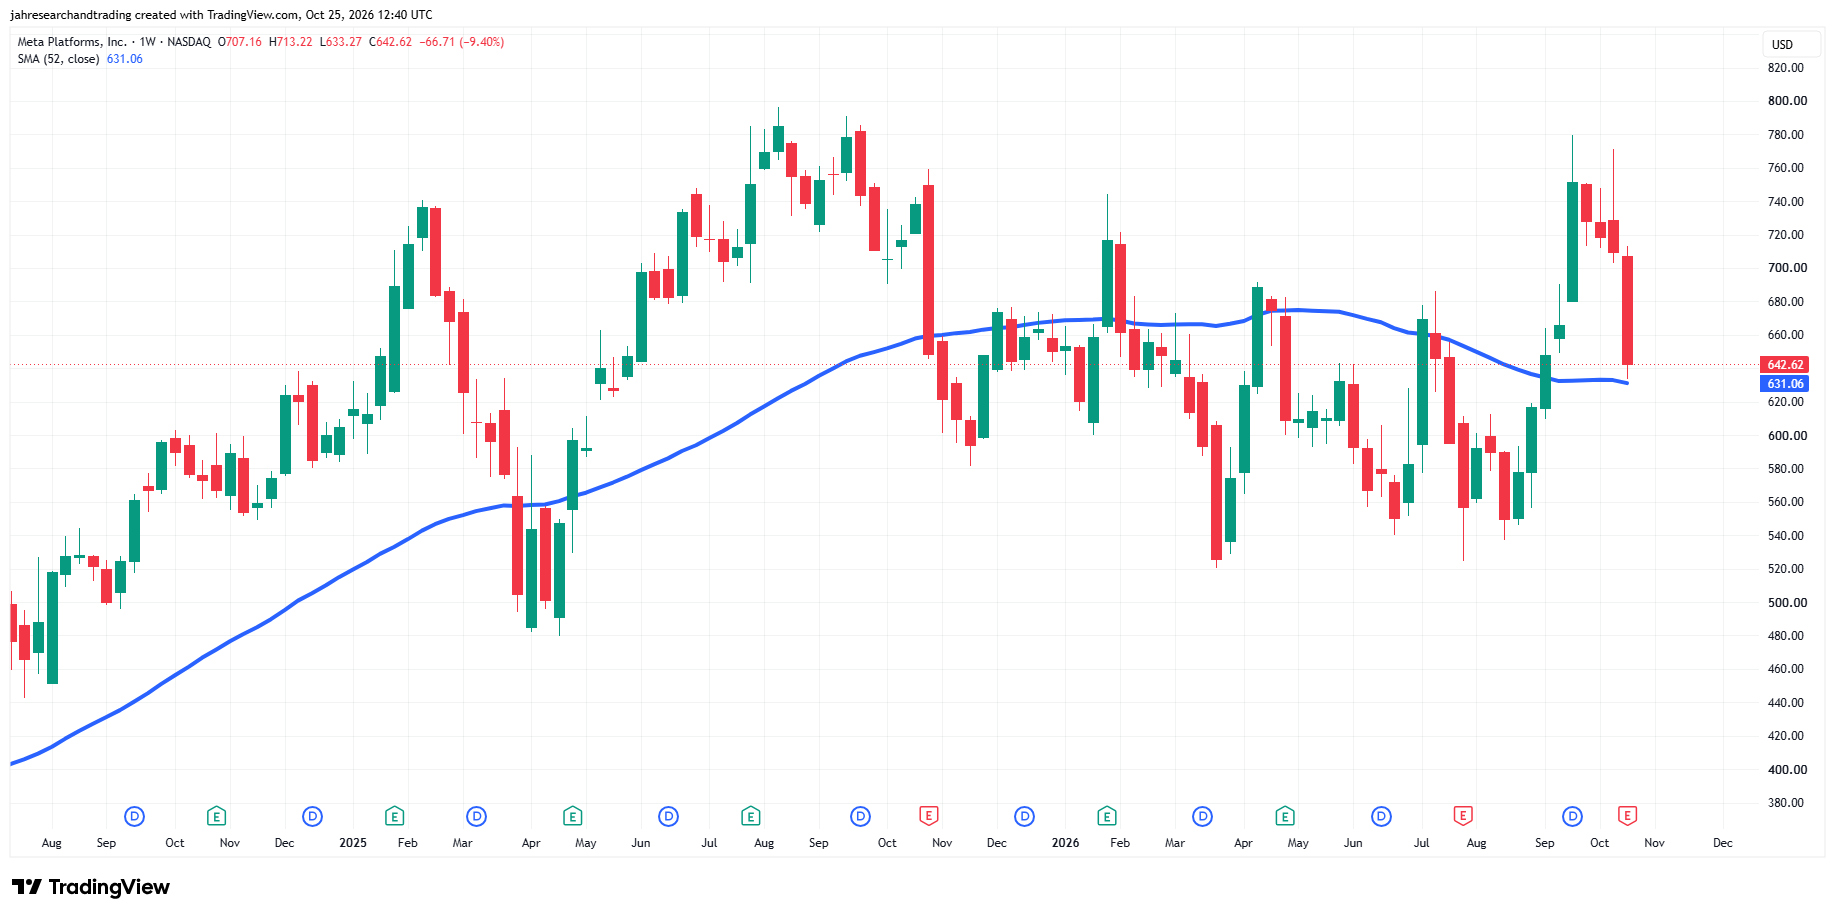
The biggest reaction in the market came after Meta Platforms reported that its free cash flow turned negative for the first time in years as its AI spending surged by nearly 80%.
Hyperscalers weren’t the only weak sub-sector. Semiconductor and hardware equipment makers like Lam Research dropped sharply due to supply chain challenges that hurt their future guidance.
Tesla was also under pressure after reporting quarterly revenue that fell slightly short of Wall Street forecasts.
While the sell-off in the tech sector received the most headlines, rising oil prices also weighed on the S&P 500 Index. Energy prices jumped due to growing political tensions in the Middle East. This reignited fears about inflation and potential Fed rate hikes.
Essentially, we saw a week where money rotated away from growth stocks and into safer assets like Treasury bonds.
Heading into this week, risk is on the table due to the Fed’s interest rate decision. The FedWatch Tool shows that investors aren’t expecting an October rate hike, but a December rate hike is still on the table. The PCE inflation report, the one favored by the Fed, is also going to be released. Investors have been pricing in a hotter inflation reading due to the jump in oil prices.
On the earnings front, we’re expecting to see reactions in the index from Amazon, Alphabet, Microsoft and Caterpillar.
Weekly S&P 500 Index (SPX) Technical Analysis
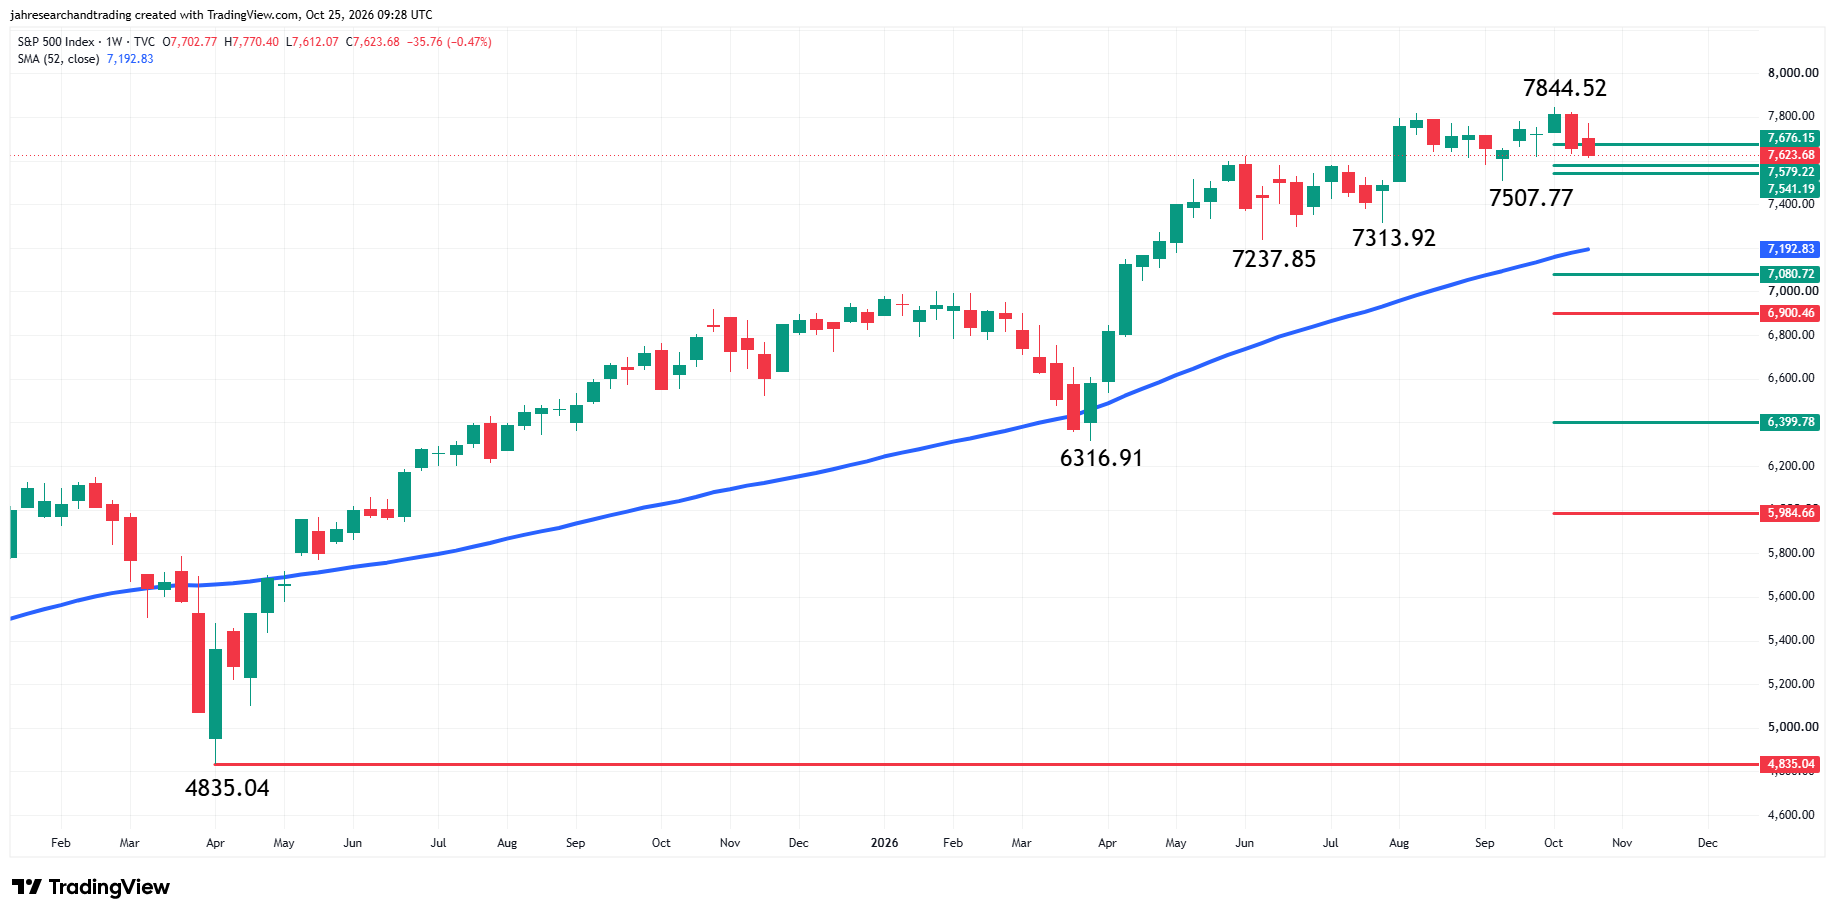
The main trend is up according to the weekly swing chart. A trade through 7507.77 will change the main trend to down. Taking out 7844.52 will signal a resumption of the uptrend.
The minor trend is down. This shifted momentum to the downside.
The minor range is 7507.77 to 7844.52. The index finished the week on the weak side of its 50% level at 7676.15. Trader reaction to this level is likely to set the tone for the week.
A pair of short-term 50% levels at 7579.22 and 7541.19 are the next potential downside targets.
The intermediate range is 6316.91 to 7844.52. Its retracement zone at 7080.72 to 6900.46 is another key target zone.
The longer-term range is 4835.04 to 7844.52. Its retracement zone at 6399.78 to 5984.66 is the major downside target area.
Weekly Amazon Technical Analysis
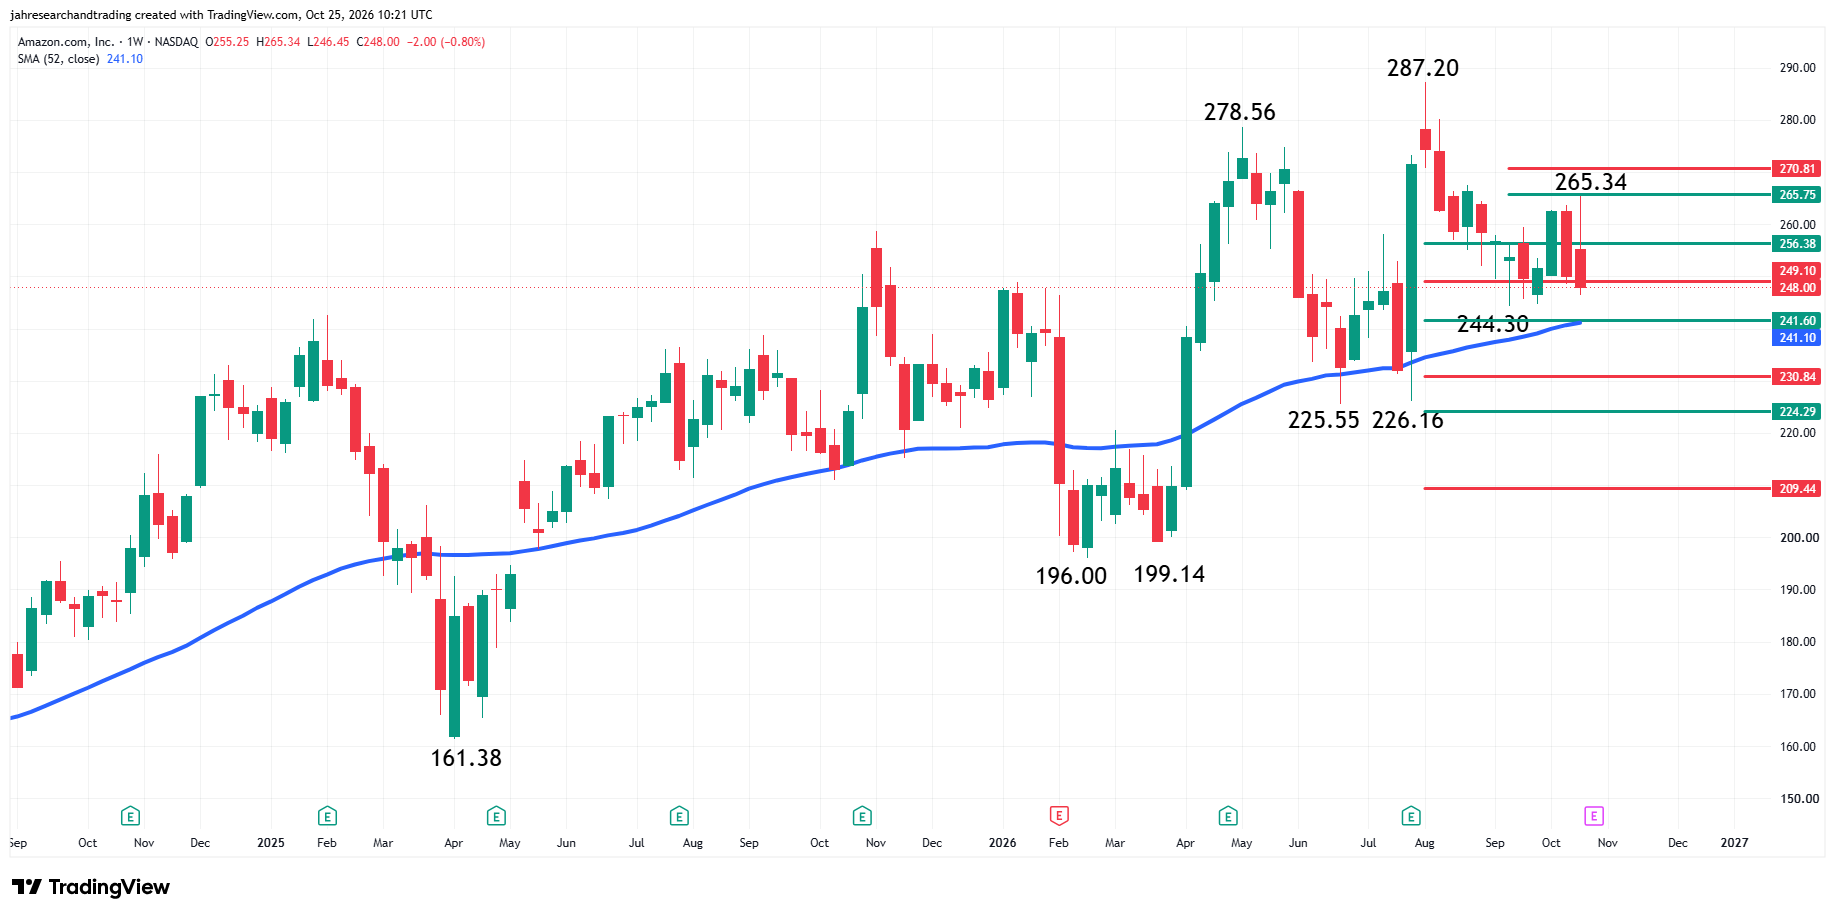
The main trend is up according to the weekly swing chart and the 52-week moving average. A trade through $265.34 will signal a resumption of the uptrend. The main trend will change to down on a break under $244.30.
The minor trend is down. This is controlling the momentum.
The 52-week moving average is providing support at $241.10. A sustained move under this indicator will strengthen the downtrend on the swing chart.
Amazon is currently straddling a 61.8% level at $249.10. Trader reaction to this level is likely to set the tone this week.
A sustained move over $249.10 will signal the return of buyers. Overcoming the 50% level at $256.38 will indicate the buying is getting stronger with $265.75 to $270.81 the next likely target zone.
A sustained move under $249.10 will indicate the presence of sellers. This could trigger a break into a support cluster formed by the 50% level at $241.60 and the 52-week moving average at $241.10. If this fails, prices could plunge into $230.84 and $224.29 to $209.44.
Weekly Caterpillar, Inc. Technical Analysis
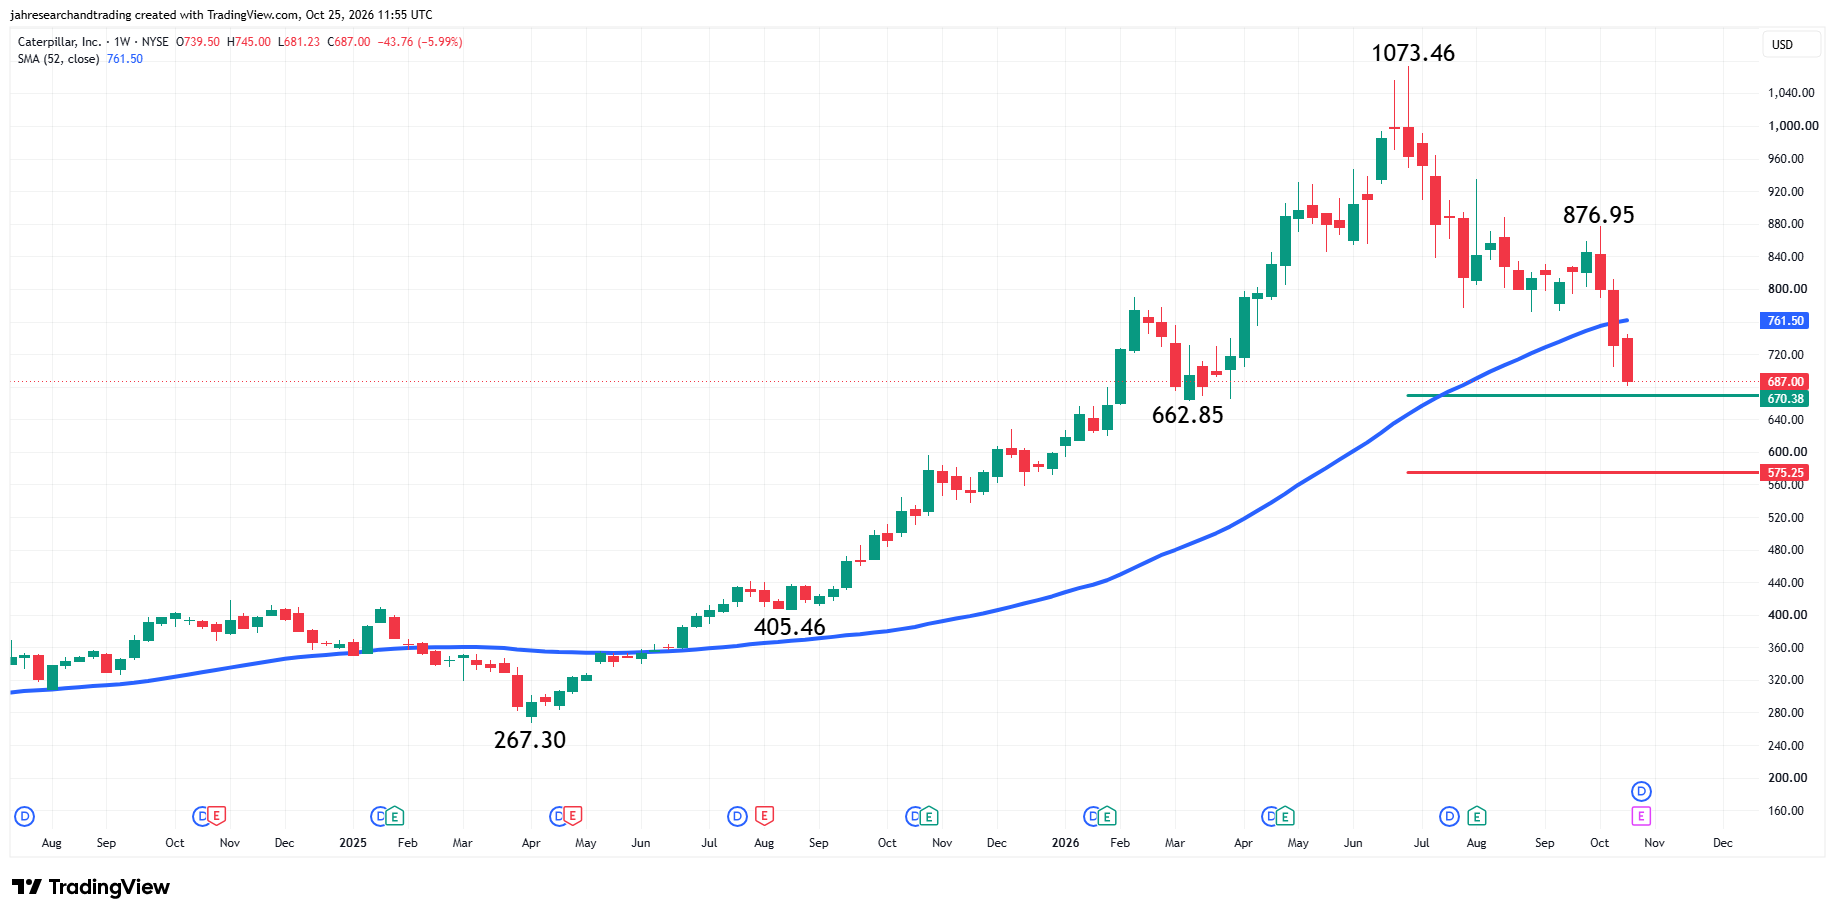
Caterpillar settled at $687.00, down 5.99% last week. For the second week in a row, the stock closed under the 52-week moving average at $761.50, putting it in a weak position. The company reports earnings on Thursday.
The main trend is down according to the weekly swing chart. A trade through the swing bottom at $662.85 will reaffirm the downtrend. The main trend will change to up when buyers take out the swing top at $876.95.
The long-term range is $267.30 to $1073.46. A test of its retracement zone at $670.38 to $575.25 could attract counter-trend buyers.
What to Watch
S&P 500 Index
The trend may be up according to the weekly swing chart and the 52-week moving average at 7192.83, but my bias has shifted to the downside because of the change in trend on the minor swing chart and the close below the pivot at 7676.15.
A failure at 7507.77 will strengthen my bias while putting the 52-week moving average on the radar. A sustained move over the pivot at 7676.15 will weaken my growing bearish outlook.
Amazon
Despite the uptrend on the main swing chart and the support from the 52-week moving average, my bias is to the downside because of the shift to the downside by the minor swing indicator and the close under the 61.8% level at $249.10. Overtaking $265.34 will shift my bias back to the upside.
Caterpillar
My bias is to the downside with the stock on the weak side of the 52-week moving average and the main trend down on the weekly chart. I’ll gain more confidence in my outlook if the swing bottom at $662.85 is taken out. However, I recognize the possibility of a technical bounce, following a test of the retracement zone at $670.38. Recapturing the 52-week moving average at $761.50 will also weaken my outlook.
More Information in our Economic Calendar.