


The S&P 500 fell on Friday as investors continued to sell technology and AI stocks. The index finished more than 10% below its record close, putting it in correction territory. Traders are worried about slower AI spending and data center construction. More Fed rate hikes are also a concern.
The selling spread across the chip sector, with memory stocks Micron Technology and SanDisk among the biggest decliners. Additionally, for a second session, the Anthropic IPO failed to revive interest in technology shares as first day investors booked profits.
The price action suggests that investors are repricing AI due to a slowdown in data center buildouts, reduced funding sources and a slower trajectory of technology-related earnings growth.
Finally, Federal Reserve Governor Christopher Waller said a half-point hike may be needed in December as policymakers try to get inflation under control. The 10-year Treasury yield fell below 5% on Friday as investors bought government bonds, but that wasn’t enough to stop the selling in stocks.
Micron Falls Below Half of June High
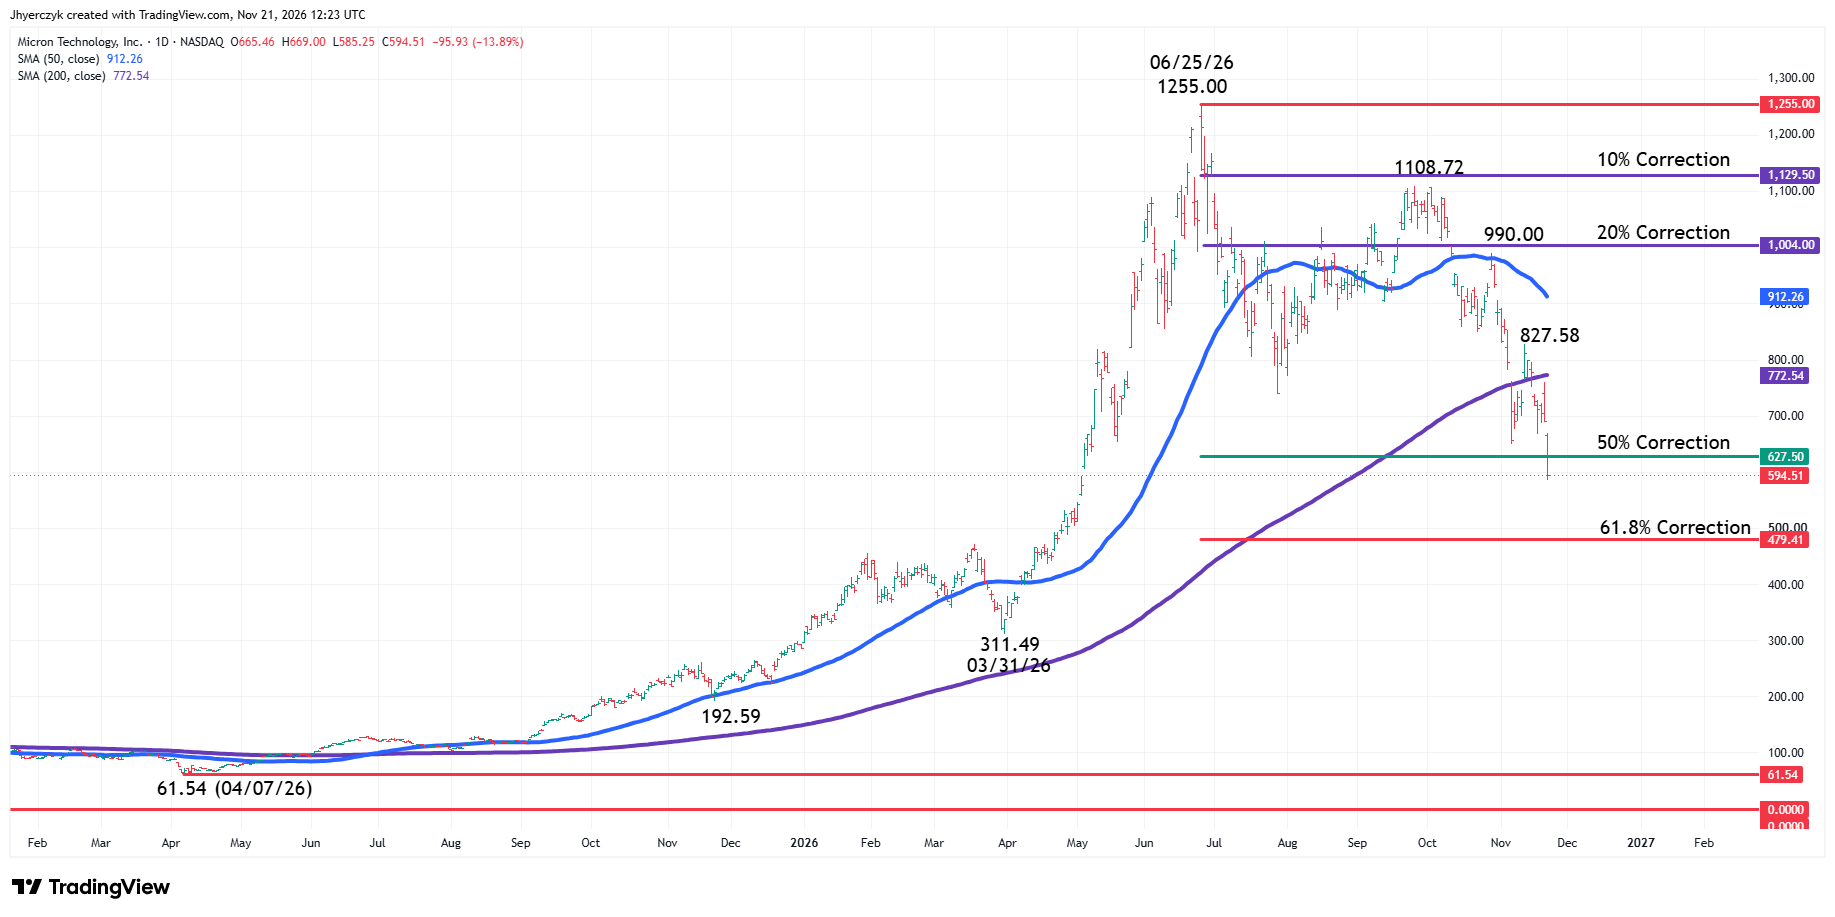
Micron fell $95.93, or 13.89%, on Friday to close at $594.51. The stock reached an intraday low at $585.25. It is down more than 50% from its June 25 high at $1255.00.
The main trend is down. The stock is trading below $627.50, or 50% of its June high. The next downside level is $479.41, a 61.8% decline from the high.
My bias is to the downside. A trade through $585.25 will signal a resumption of the decline and put $479.41 on the radar. A move back above $627.50 will weaken my bearish outlook.
SanDisk Gives Back More Than 70%
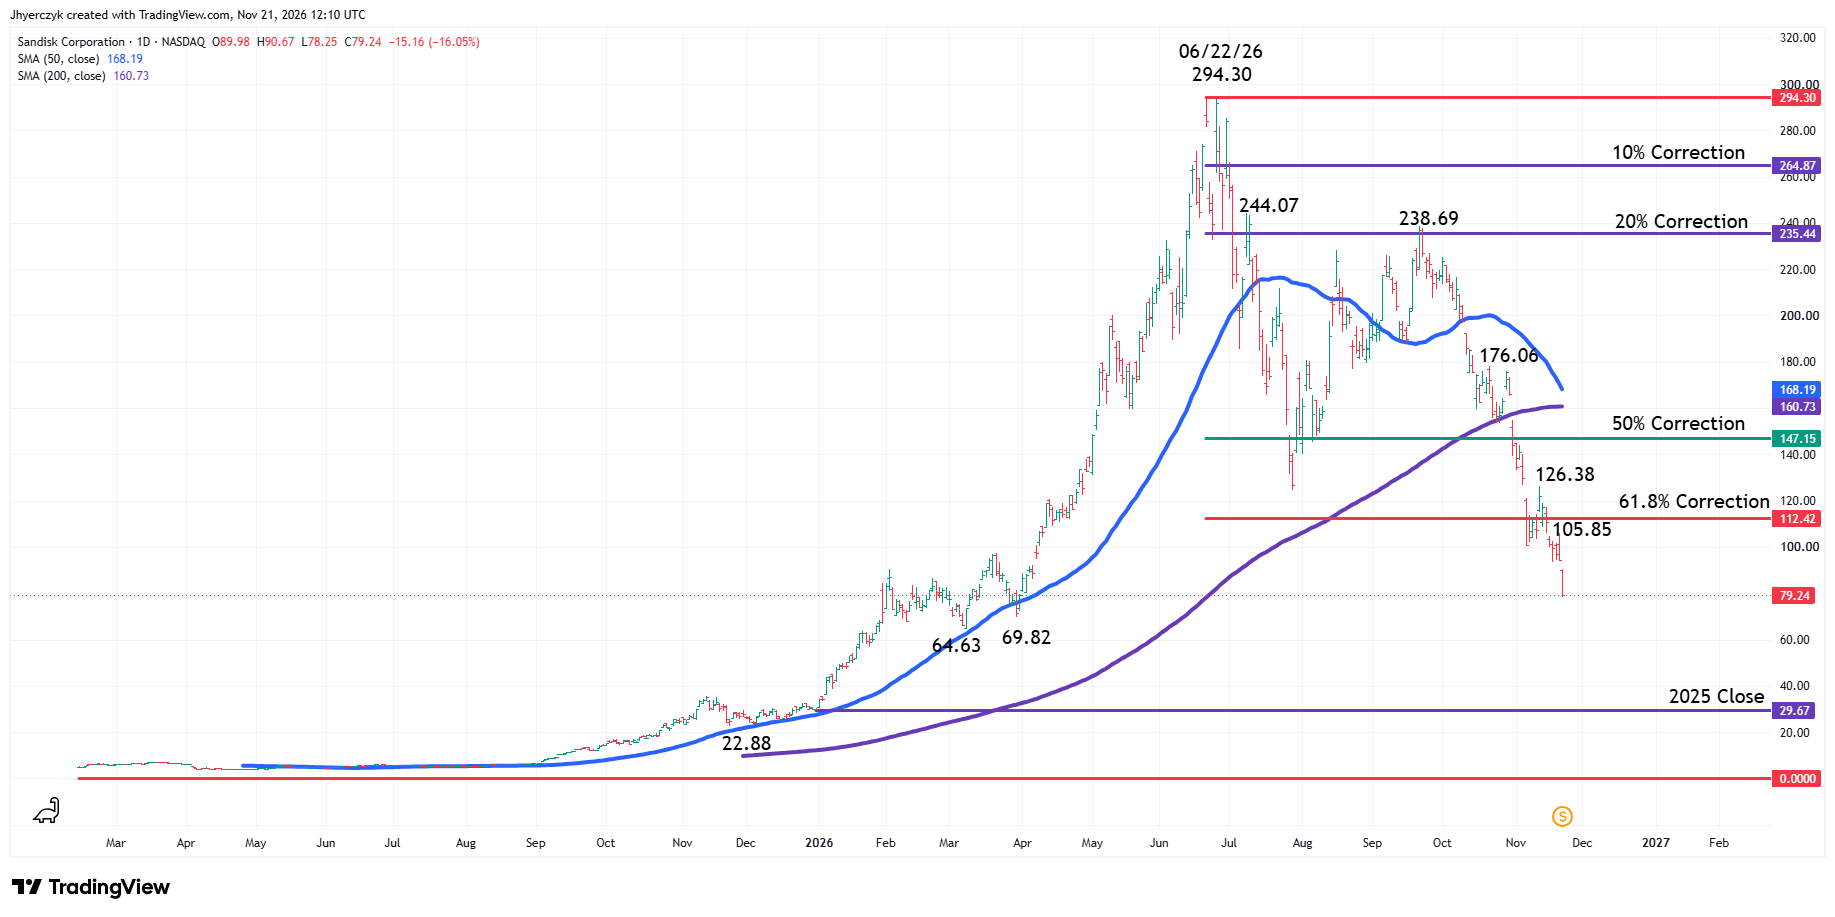
SanDisk closed at $79.24 on Friday, down $15.16 or 16.05%. The stock reached an intraday low at $78.25. It is down more than 70% from its June 22 high at $294.30.
The main trend is down. SanDisk is trading below $112.42, a 61.8% decline from its high. The next potential downside targets are the previous bottoms at $69.82 and $64.63.
My bias is to the downside. A trade through $78.25 will signal a resumption of the decline. Recovering $105.85, followed by $112.42, will weaken my bearish outlook.
The steep declines have made some memory stocks look cheap, but analysts caution that low valuation multiples in the sector have historically appeared near peaks in memory pricing.
Daily S&P 500 Index Technical Analysis
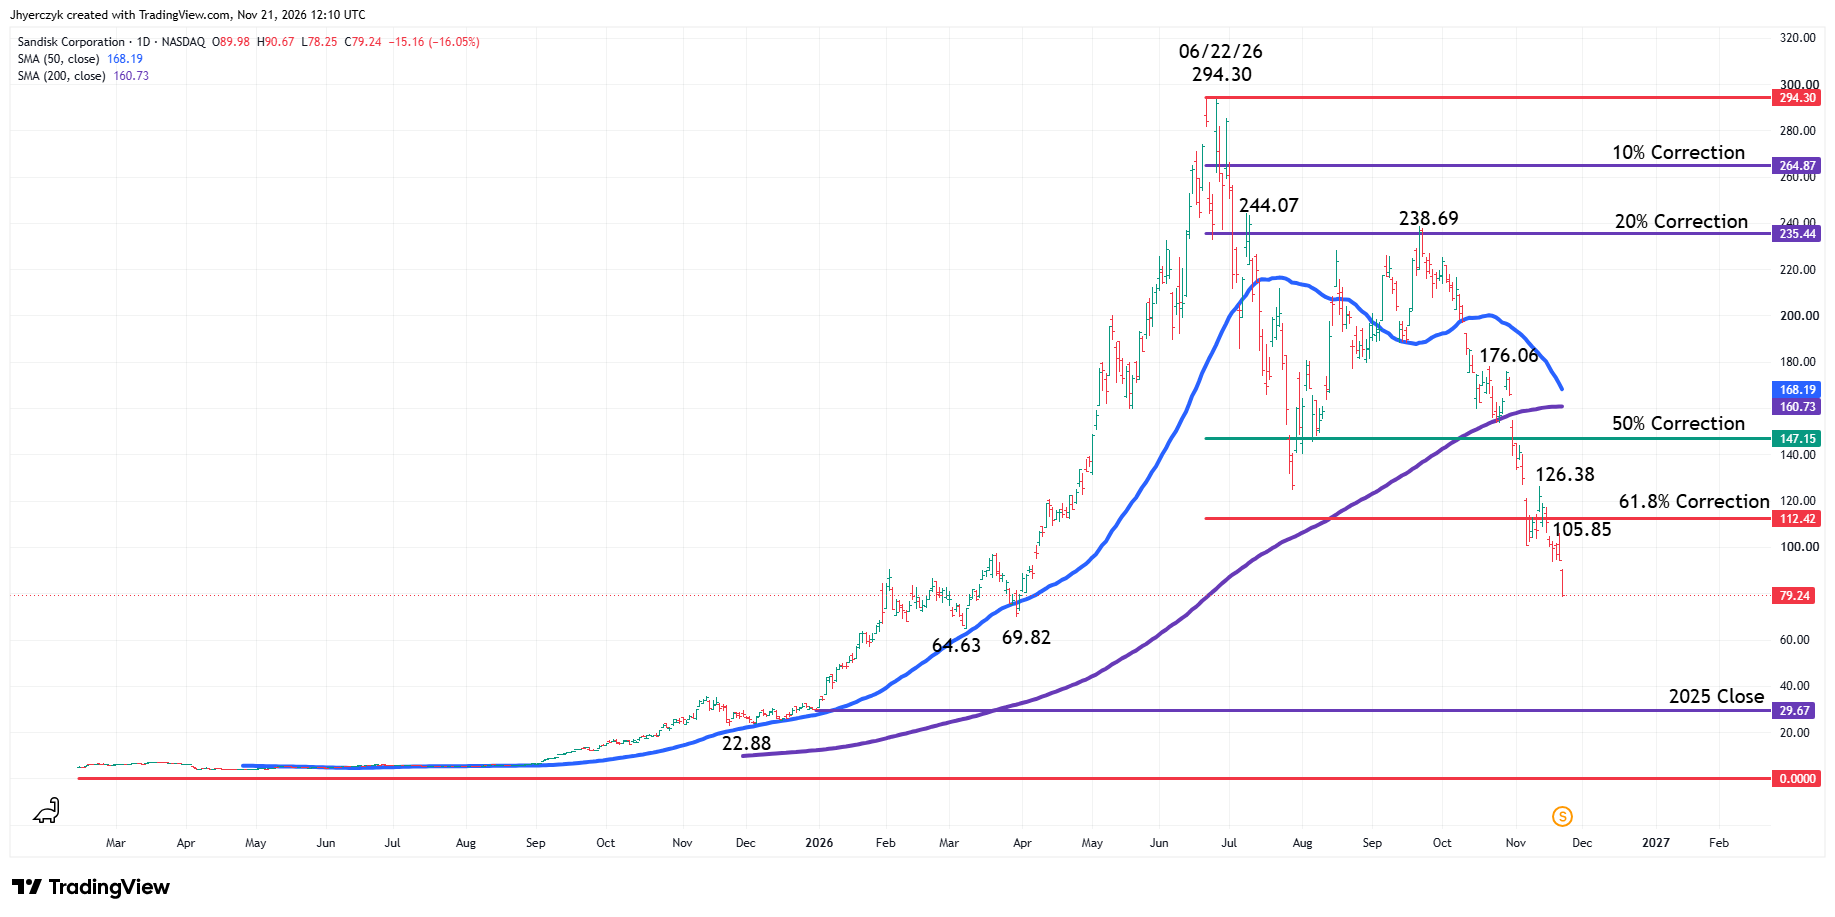
The S&P 500 Index closed at 6910.39 on Friday, down 265.44 or 3.70%. The index reached an intraday low at 6882.66 and finished above its 2025 close at 6845.49.
The main trend is down according to the daily swing chart. A trade through Friday’s low at 6882.66 will signal a resumption of the downtrend. Taking out the main top at 7415.64 will change the main trend to up.
The index is trading below the 50-day moving average at 7625.26 and the 200-day moving average at 7348.58. It has also broken the uptrending line drawn from the April 7, 2025 bottom at 4835.04 through the March 30, 2026 bottom at 6316.91.
The October 6 high at 7844.52 and the March 30 bottom at 6316.91 formed an intermediate retracement zone at 7080.72 to 6900.46. The S&P 500 closed inside this zone on Friday after trading through the lower level.
The long-term range is 4835.04 to 7844.52. Its retracement zone is 6339.78 to 5984.66. The March 30 main bottom at 6316.91 falls inside this zone.
What to Watch
My bias is to the downside because the main trend is down and the S&P 500 is trading below the uptrending line and both moving averages.
A trade through Friday’s low at 6882.66 will strengthen my bearish outlook and put the 2025 close at 6845.49 at risk. If that level fails to hold, the index will turn lower for the year. Continued selling could put the long-term 50% level at 6339.78 and the March 30 bottom at 6316.91 on the radar.
A sustained move over 6900.46 will weaken my downside bias. The next upside target is 7080.72. The 200-day moving average at 7348.58 and the main top at 7415.64 are potential resistance.
More Information in our Economic Calendar.