
Advertisement
Advertisement
Technical Outlook – US Dollar Index, Gold and Silver
By:
US Dollar Index Even after the break of short-term ascending trend-channel, 50-day & 100-day SMA confluence area, between 96.40-30, seems restricting
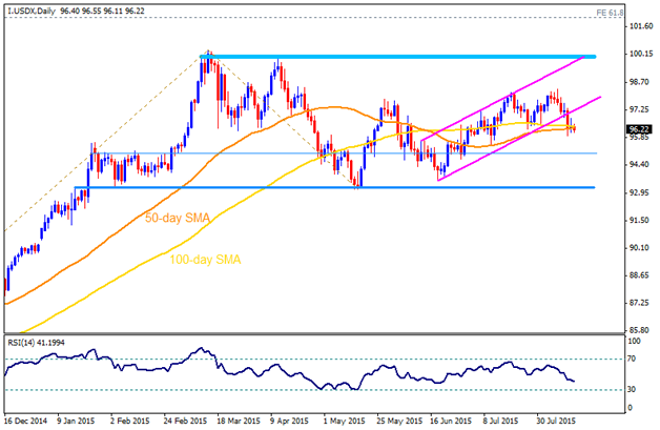
US Dollar Index [I.USDX]
Even after the break of short-term ascending trend-channel, 50-day & 100-day SMA confluence area, between 96.40-30, seems restricting the index decline towards 95.00 horizontal mark; however, a slid below 95.00 could be limited by the 93.30-10 support-zone. Should the index manages to break 93.10, also breaks the 93.00 round figure on a closing basis, it could plunge to 90.00 psychological magnet. Alternatively, a bounce from the current level may cause the index price to test 97.00 – 97.10 area, breaking which 98.50 and the 99.20 are likely intermediate resistances prior to its test of channel resistance and the horizontal mark, between 99.90 – 100.00 that could become important to determine near-term moves. Moreover, a close above 100.00 mark could provide considerable strength to the index that can fuel it towards 61.8% FE of its October 2014 to April 2015 up-move, near 102.00 round figure mark.
GOLD
Failure to break the descending trend-channel support on weekly chart, near $1070-80 area, pulled back the Gold prices towards breaking short-term descending trend-line resistance, signaling march towards $1130 and the $1147-50 horizontal resistances. However, further up-side by the yellow metal seems to be restricted near $1165-70 area, encompassing the 38.2% Fibo of its January-July decline, 100-day SMA and seven month old descending trend-line. On the downside, $1100 mark provides an immediate support to the bullion prices, breaking which the $1070-80 area against comes into play. Should it sustains the downtrend below $1070, the gold prices may plunge to $1000 psychological magnet.
SILVER
Metal’s bounce from $14.50 managed to surpass 50-day SMA and the 23.6% Fibo of its January – July decline, near $15.30; though, $15.70 and the confluence of 100-day SMA together with 38.2% Fibo, near $16.00 mark, may provide strong resistance to restrict the near-term up-move by the Silver prices. However, the metal’s ability to close above $16.00 can fuel it towards $17.00 and the $17.30 important resistances. On the downside, a close below $15.30 can quickly pull the metal prices back towards $14.90 area, prior to test $14.50-40 support-zone, breaking which the $14.00 and the $13.50 are likely consecutive supports that the silver prices may target on its continued downtrend.
Follow me on twitter to discuss latest markets events @Fx_Anil
About the Author
Anil Panchalauthor
An MBA (Finance) degree holder with more than five years of experience in tracking the global Forex market. His expertise lies in fundamental analysis but he does not give up on technical aspects in order to identify profitable trade opportunities.


Advertisement