


Earnings Catalyst Fuels Breakout
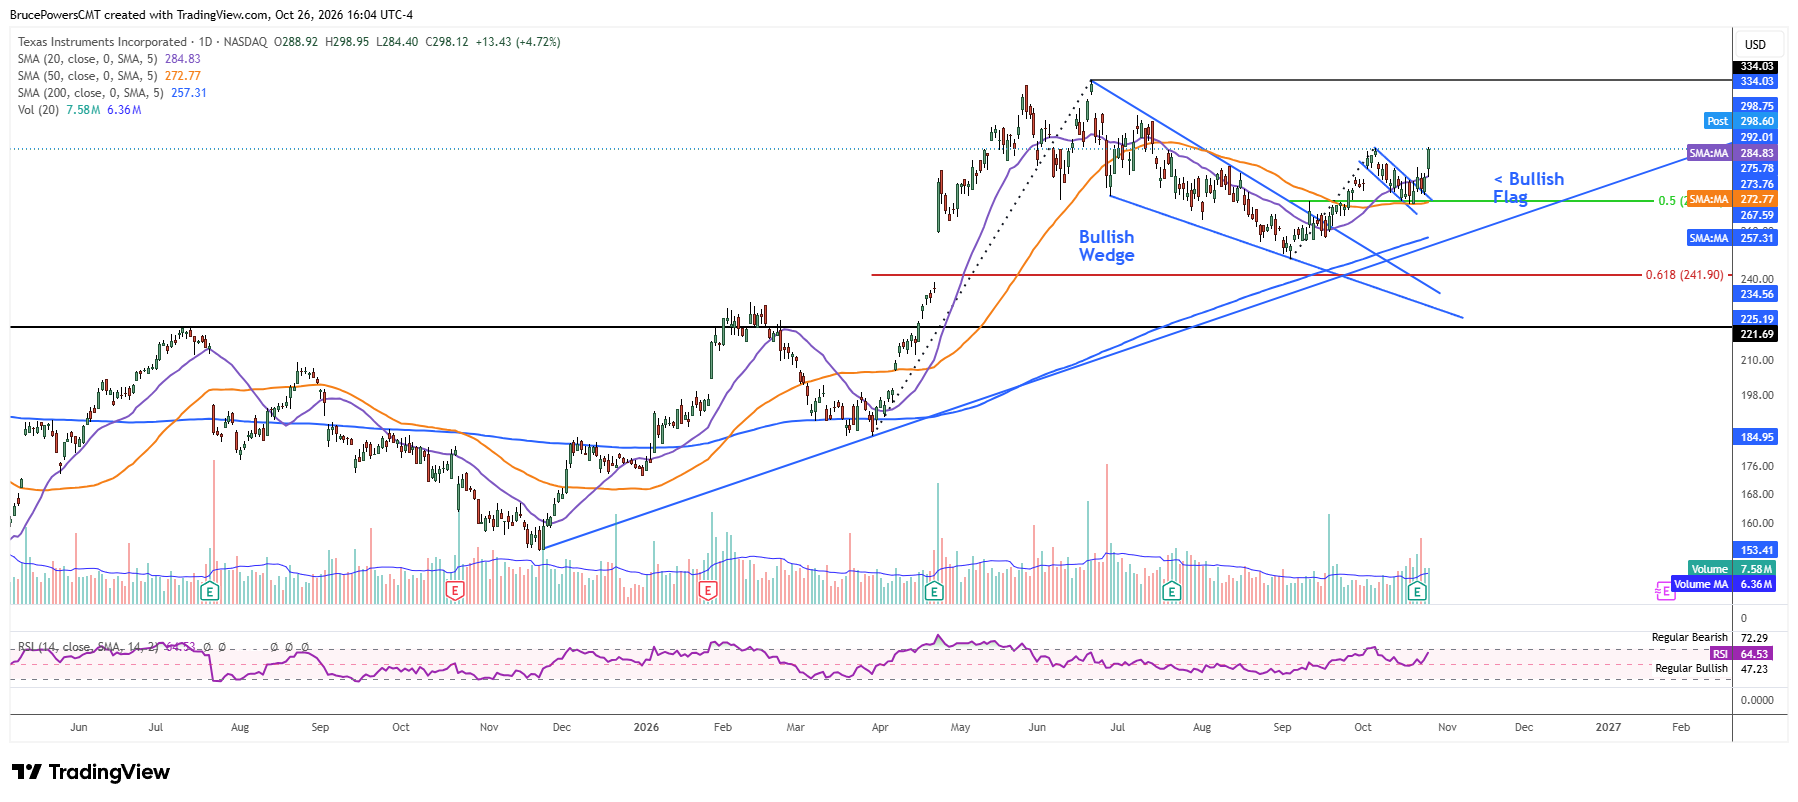
Texas Instruments (TXN), a global semiconductor company, appears poised to extend its advance toward potential new highs following its Q3 2026 earnings report, released after Wednesday’s market close on October 21. Although the initial response was muted, a rally on Monday to a high of $298.95 confirmed an upside breakout from a small bullish flag pattern that triggered last week following a 50% retracement of the prior advance and a successful test of support at the 50-day moving average. The pullback established a higher swing low of $272.01, defining key near-term structural support.
Moving Averages Confirm Bullish Momentum
Reinforcing the bullish signal was Monday’s successful test of support at the 20-day moving average, with the session’s low of $284.40. TXN had traded below the average for the prior seven days. The move back above the average, following its recent role as resistance, provides another bullish indication in the recent price action.
Larger Pattern Supports Further Upside
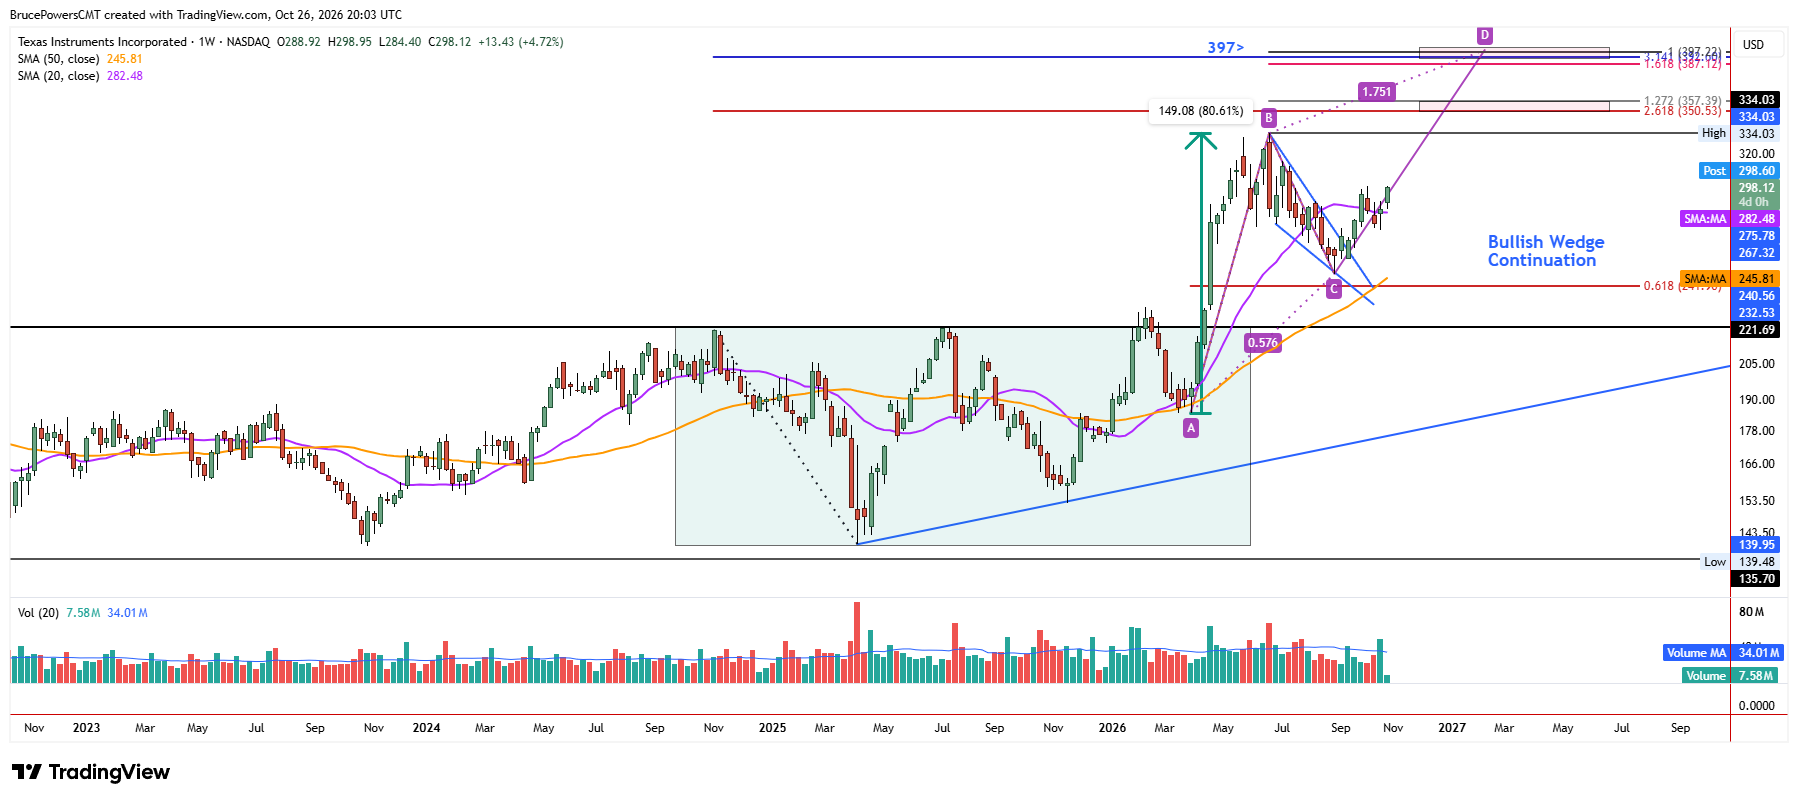
The small bullish flag pattern followed an upside breakout from a large falling wedge continuation pattern that triggered in September. That breakout was preceded by a sharp advance of over 80% and suggests another sustained momentum move could occur again now that the bearish correction appears to have completed. Monday’s test of support at the 20-day moving average reinforces its role as short-term support for the developing trend. Together, these pattern structures show a constructive progression of the long-term bullish trend following an upside breakout from a large basing formation in April.
$334 Breakout Target Opens Path Toward $397
With the correction apparently complete and earnings reported, TXN is poised to continue advancing toward possible new highs. The prior high at $334.03 is an initial upside target, with a reasonable prospect of being reached if bullish momentum persists. It is followed by two potential resistance zones defined by Fibonacci projection and extension measures. The first zone is between $350 and $357, and the second extends from approximately $387 to $397. The higher price zone includes the 100% projection for a rising ABCD pattern, where two advancing price legs are equal in magnitude.
If you’d like to know more about technical analysis and how traders use it, please visit our educational area.