


Top Ethereum (ETH) analysts predict a strong upward move toward $4,500 in February amid a slew of bullish indicators ranging from fundamental to technical.
Ethereum’s Expansion Phase Has Begun
Market analyst Ted Pillows highlighted Ethereum’s entry into its short-term expansion phase, following a period of accumulation between $3,100 and $3,250 and manipulation that briefly dropped ETH to around $3,080.
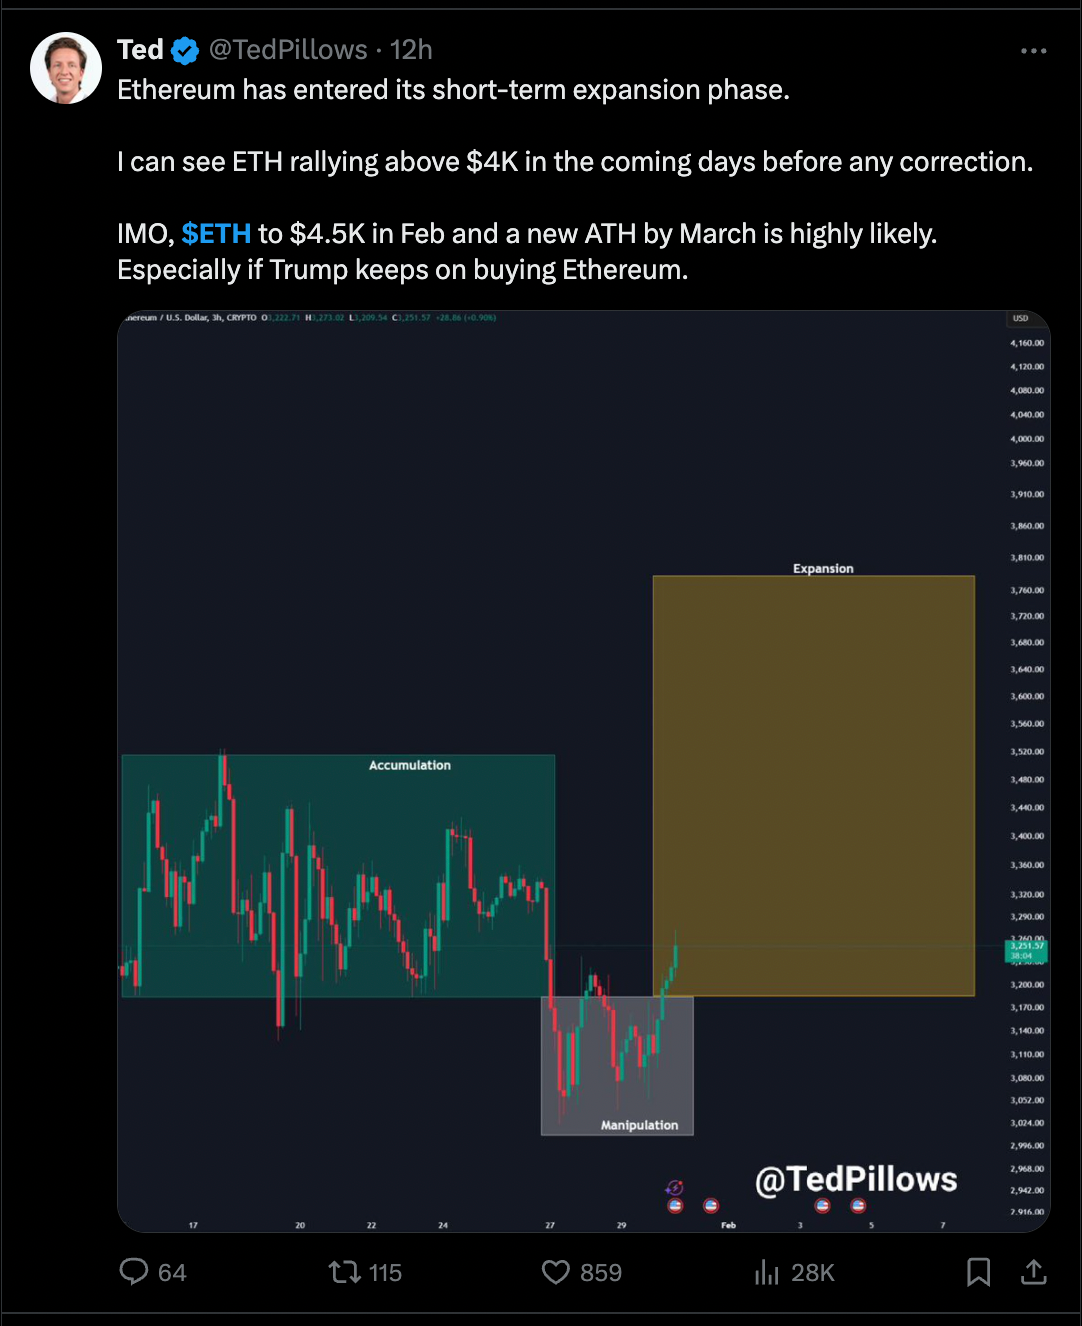
His analysis suggests that ETH could rally above $4,000 in the coming days, potentially reaching $4,500 by February. He also linked Ethereum’s bullish outlook to Donald Trump’s aggressive ETH purchases, which continue to drive market confidence.
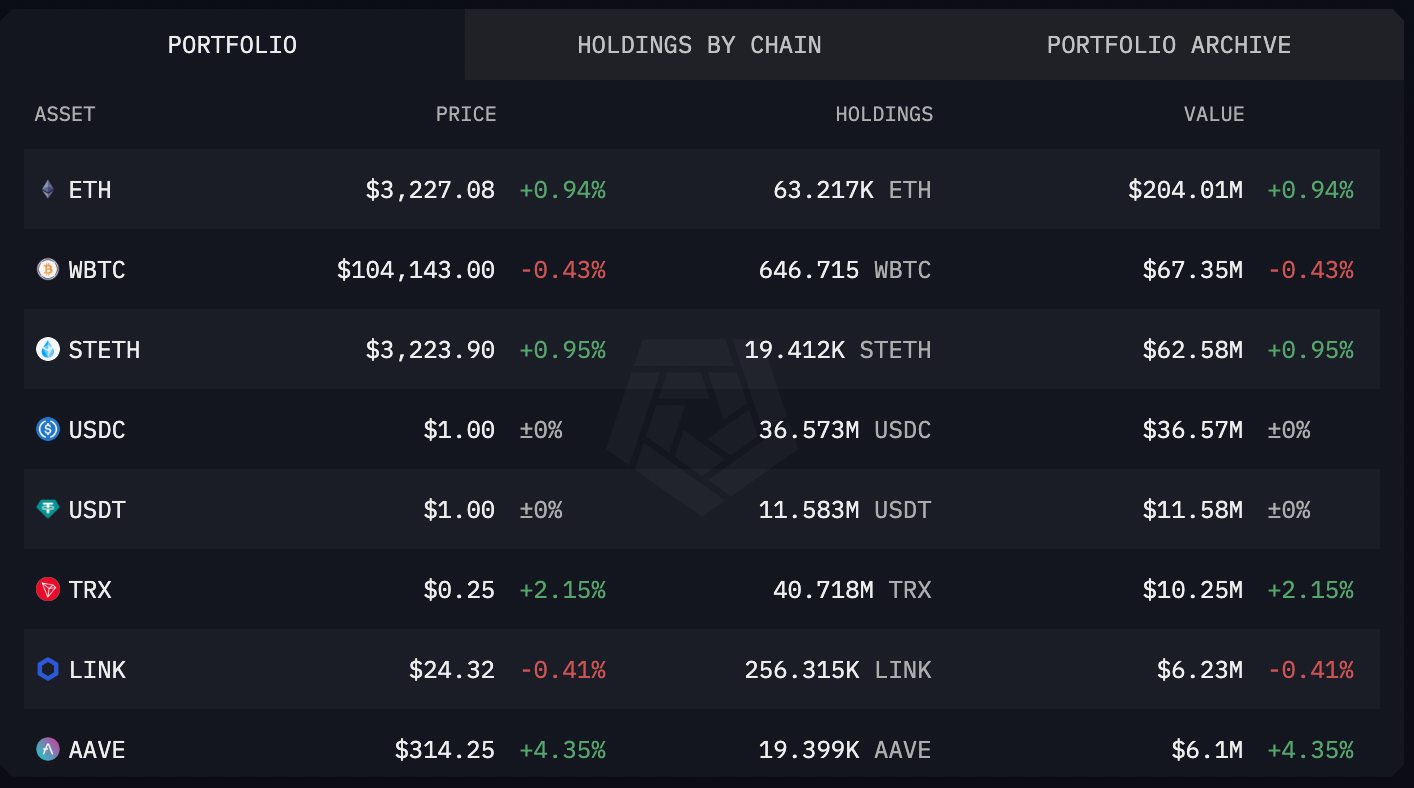
On inauguration day alone, WLFI bought $47 million worth of ETH and continued acquiring $10 million worth daily. This consistent buying pressure has helped stabilize ETH’s price and reinforced bullish sentiment in the market.
Meanwhile, analyst Karan Singh Arora emphasized the critical resistance level at $3,344, marking it as the “flip-to-pump” zone.
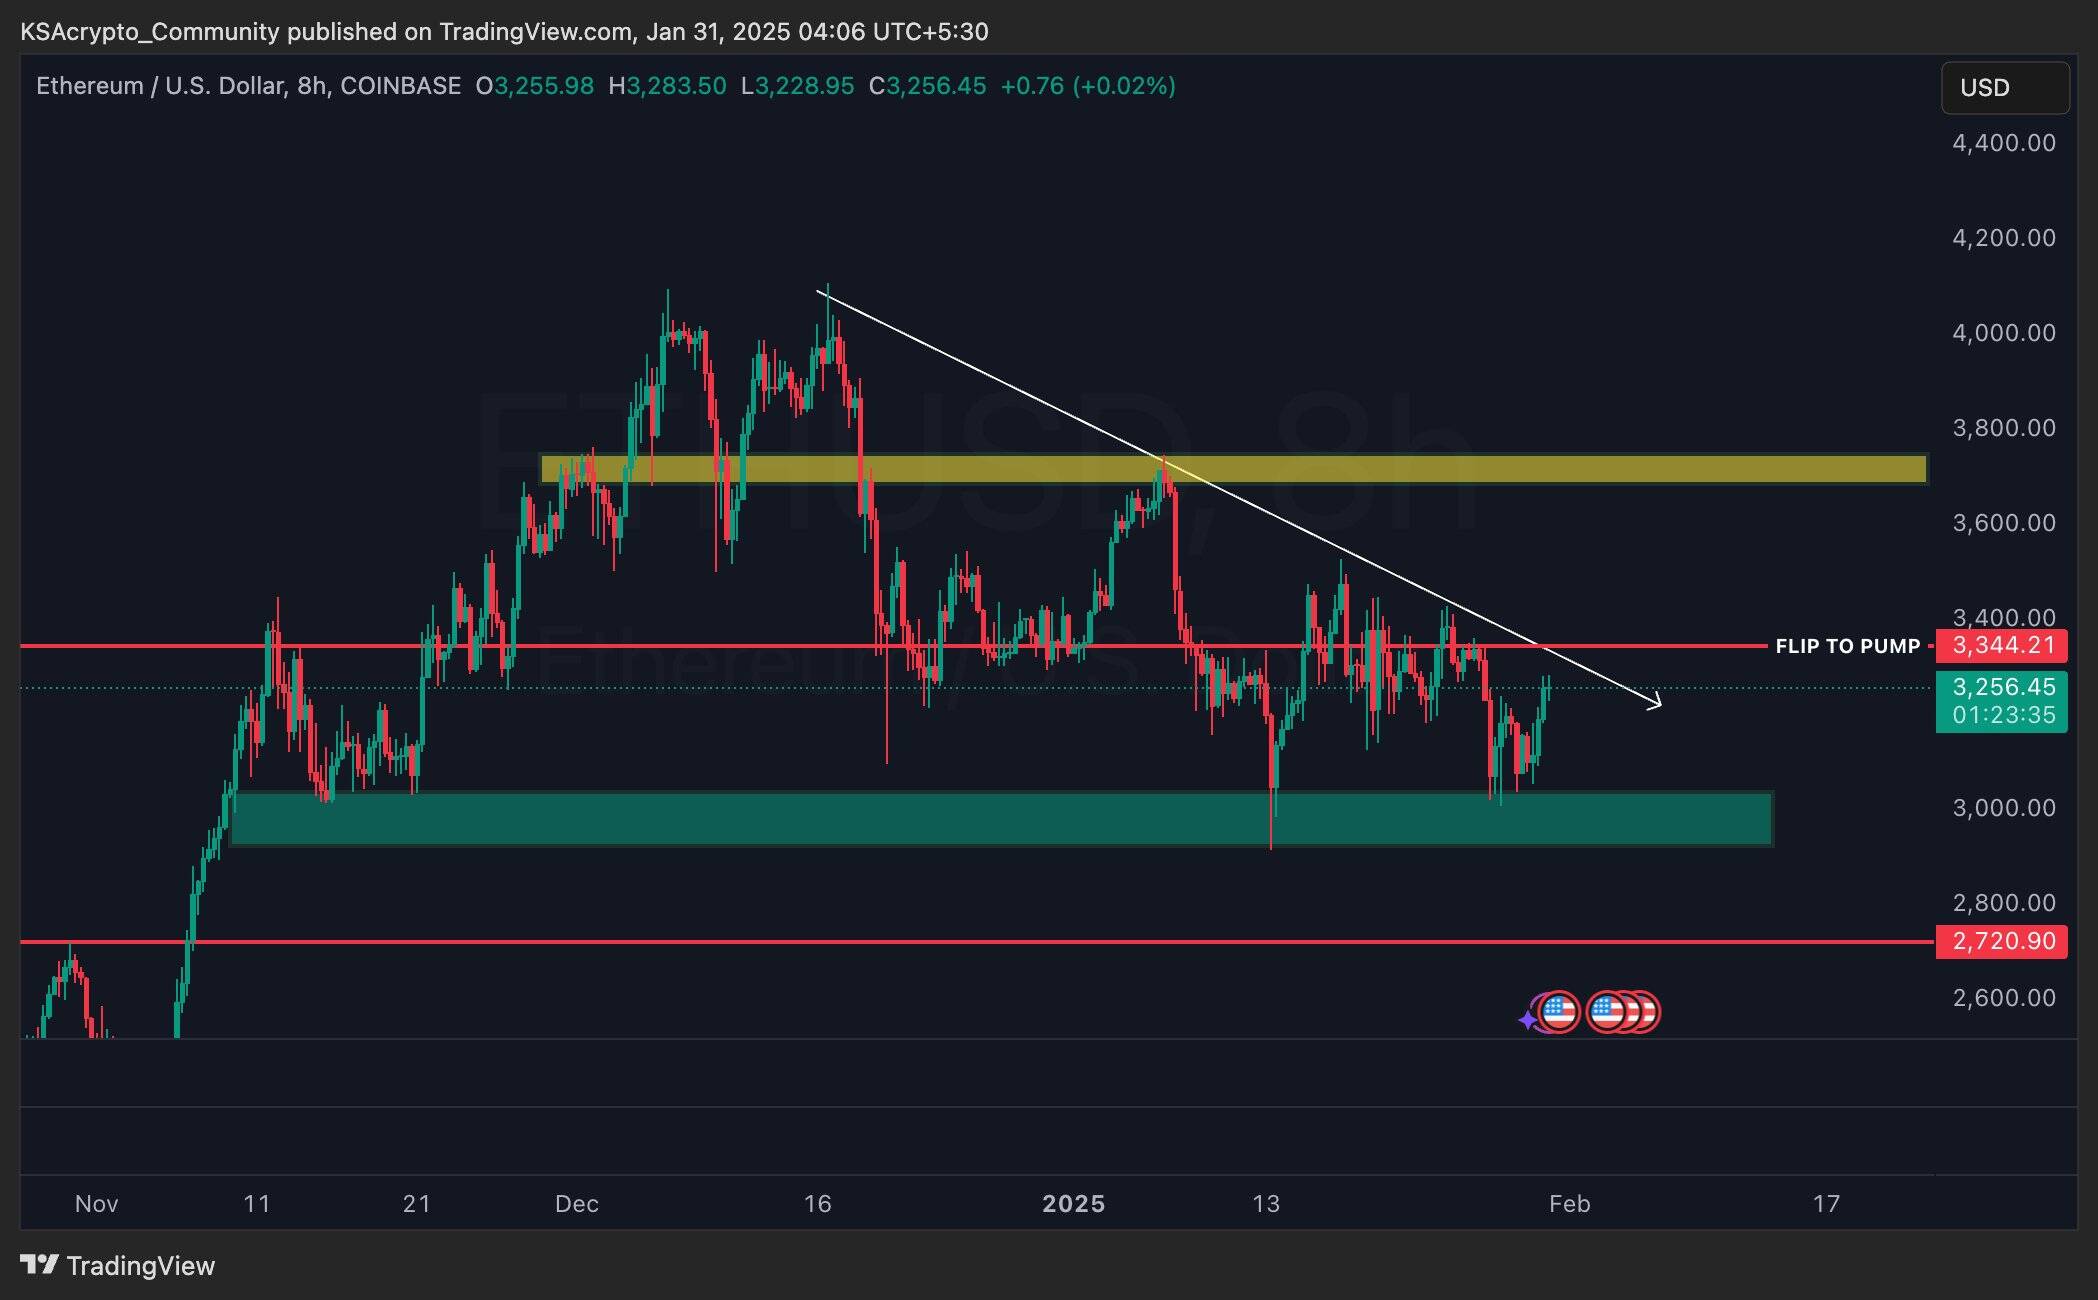
If ETH secures a daily close above this level, it could push toward the next resistance area near $3,800, with a broader breakout potentially targeting the $4,000 mark.
However, failure to break this resistance could trigger a retracement to the $2,980–$2,810 range, where a strong demand zone exists.
Ethereum Price Forecast
Every new Ethereum analysis as it publishes, today's technical signal and key levels, live price — on one page.
See all Ethereum forecastsEthereum Falling Wedge and Bullish Divergence: Cas Abbe’s View
According to Cas Abbe, Ethereum is currently one of the most undervalued crypto assets. Despite spot ETH ETFs going live and Trump buying over $10 million in ETH daily, the price remains 35% below its all-time high.
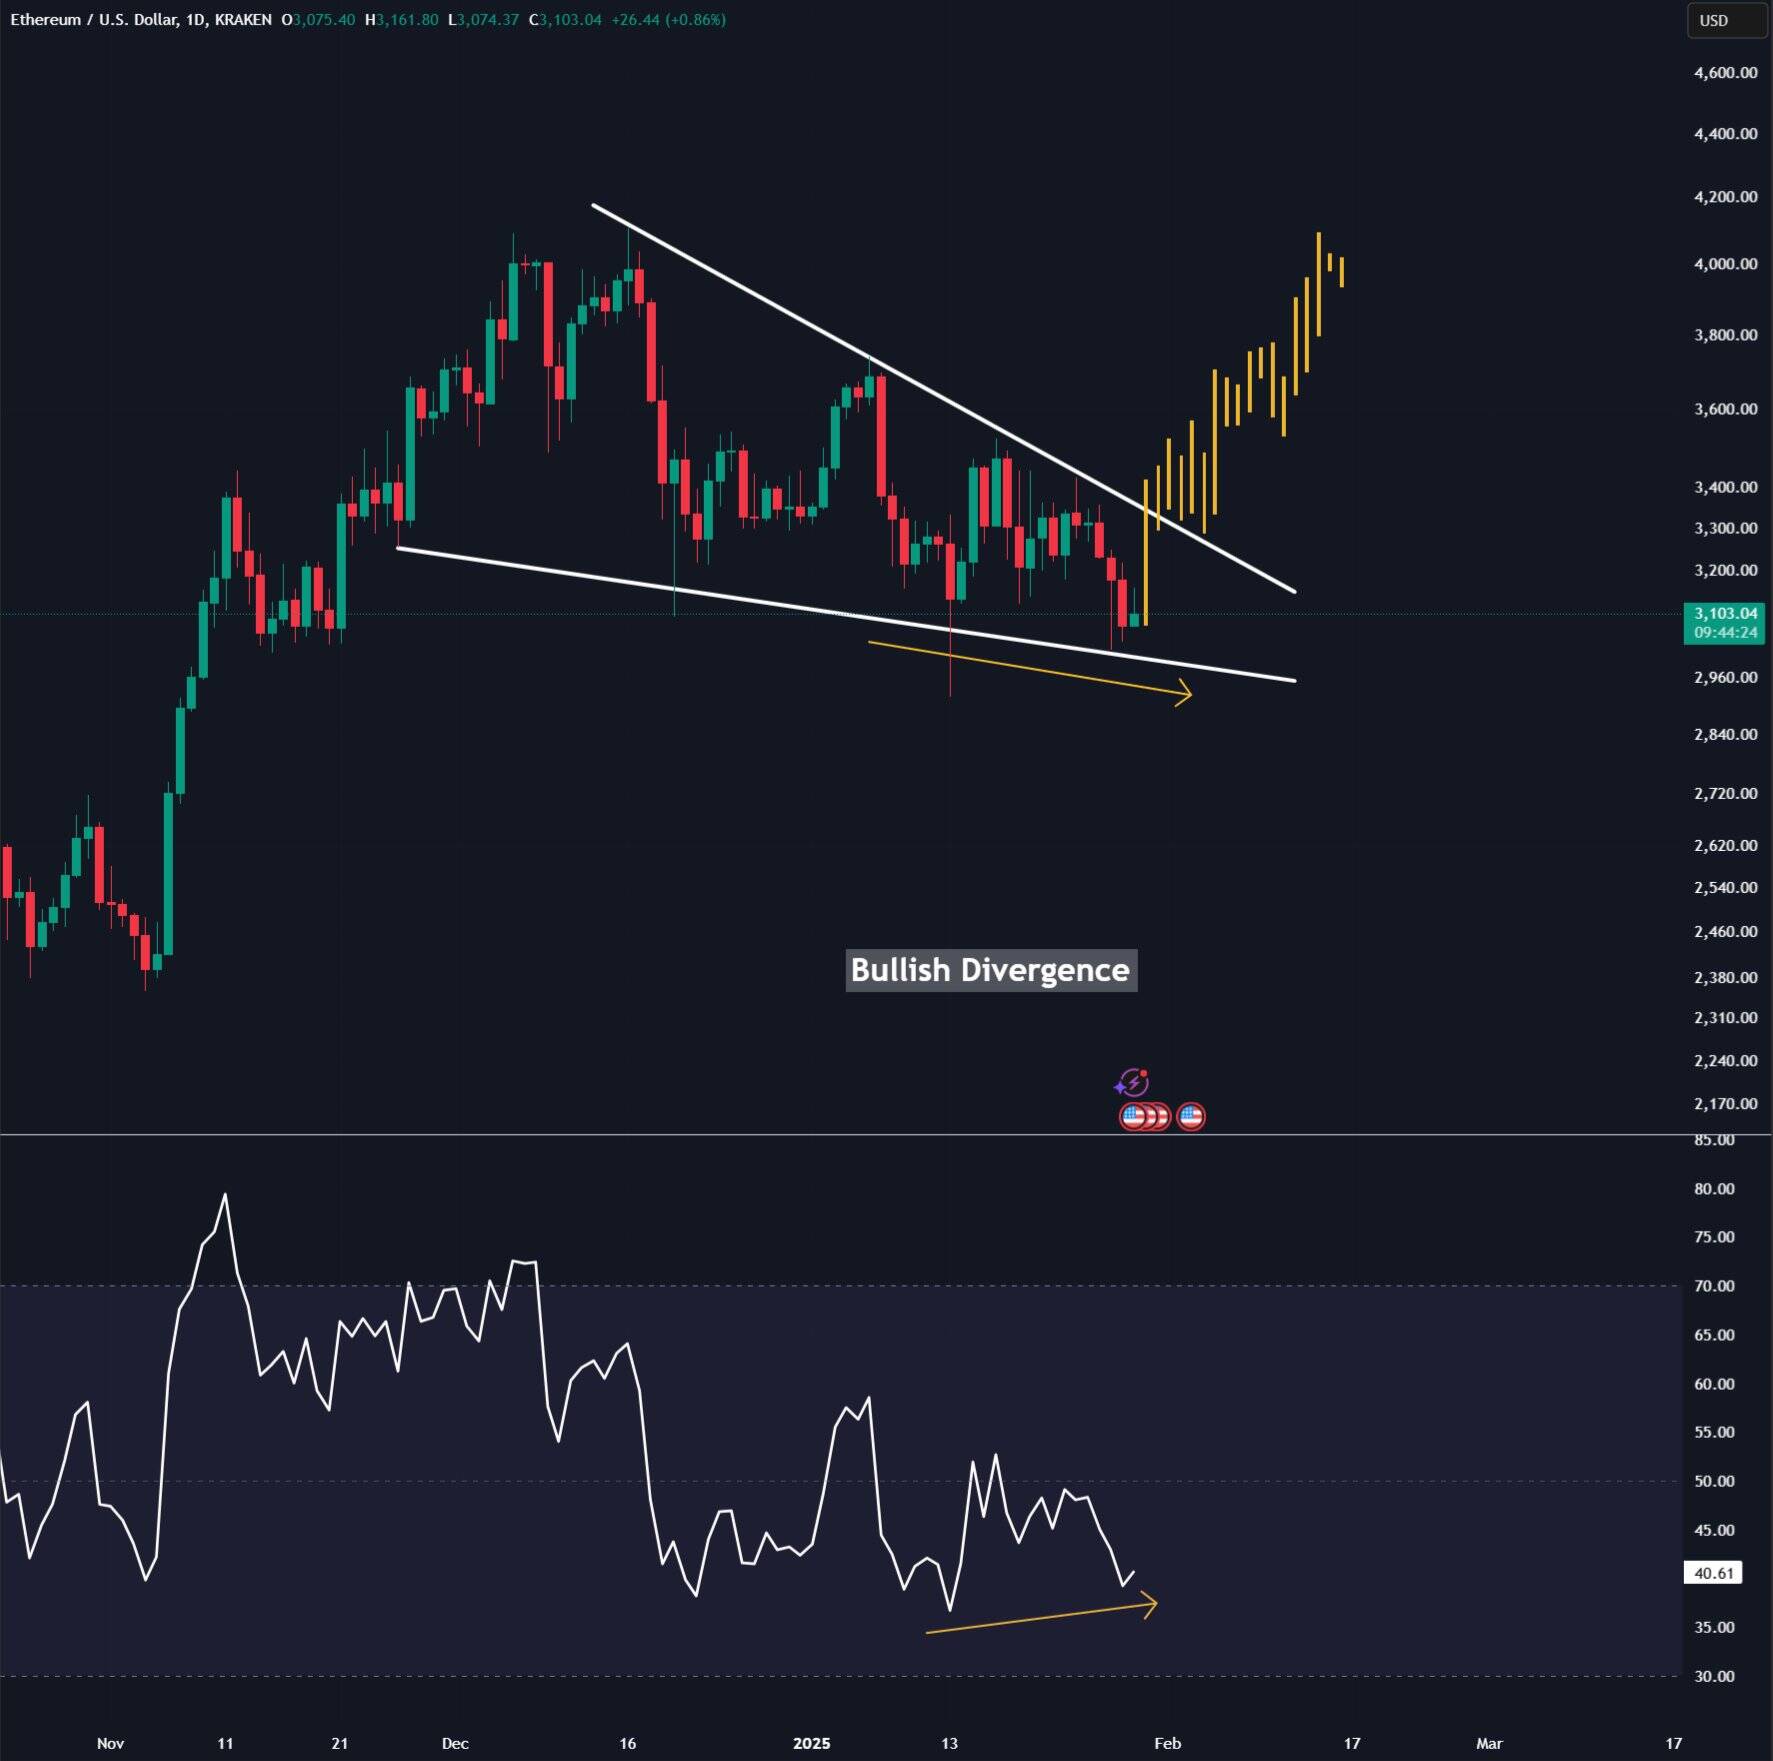
He pointed out a bullish divergence and a falling wedge pattern on ETH’s daily chart, which historically signal a trend reversal. The wedge’s breakout is around $3,200, with an initial upside target of $3,600 and an extended move toward $4,000–$4,500.
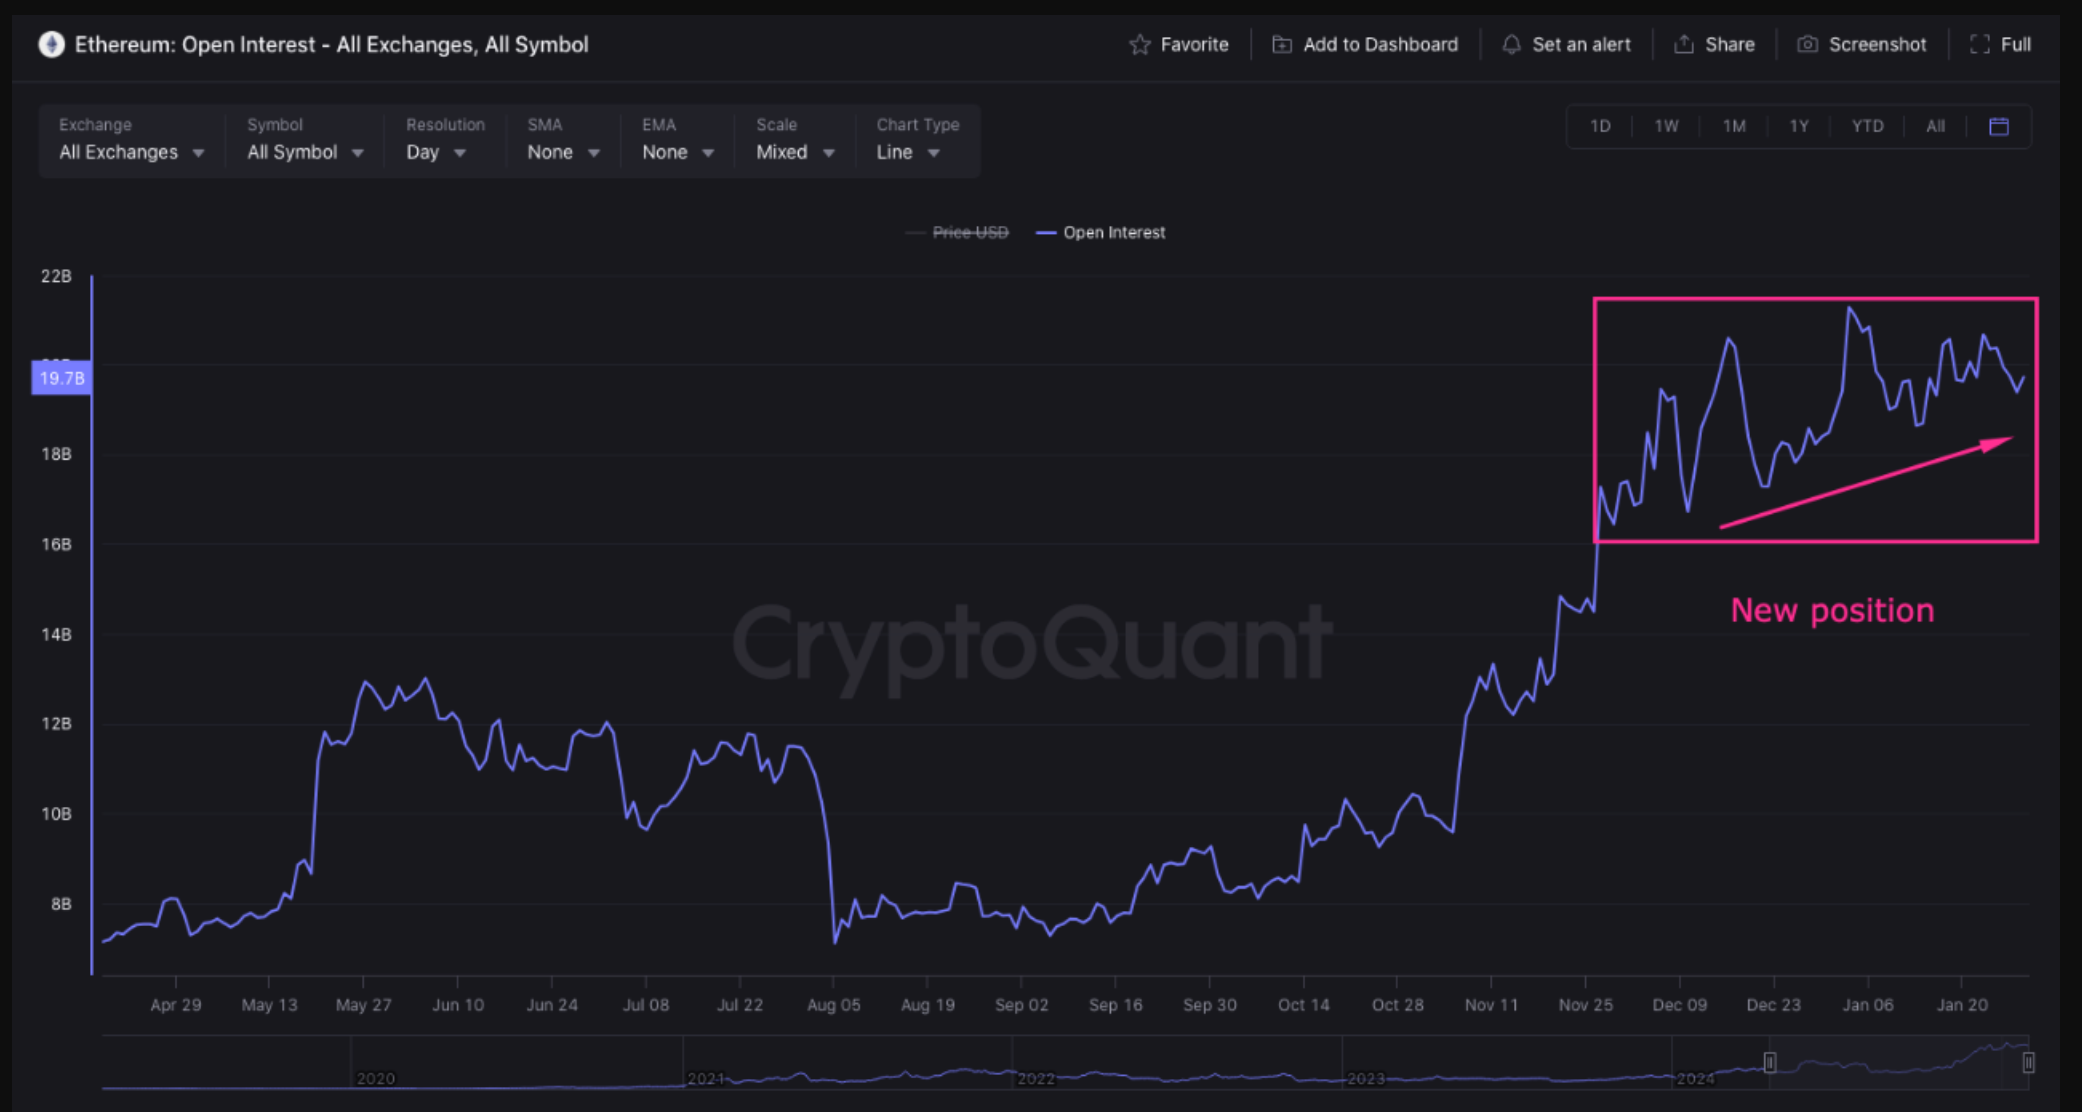
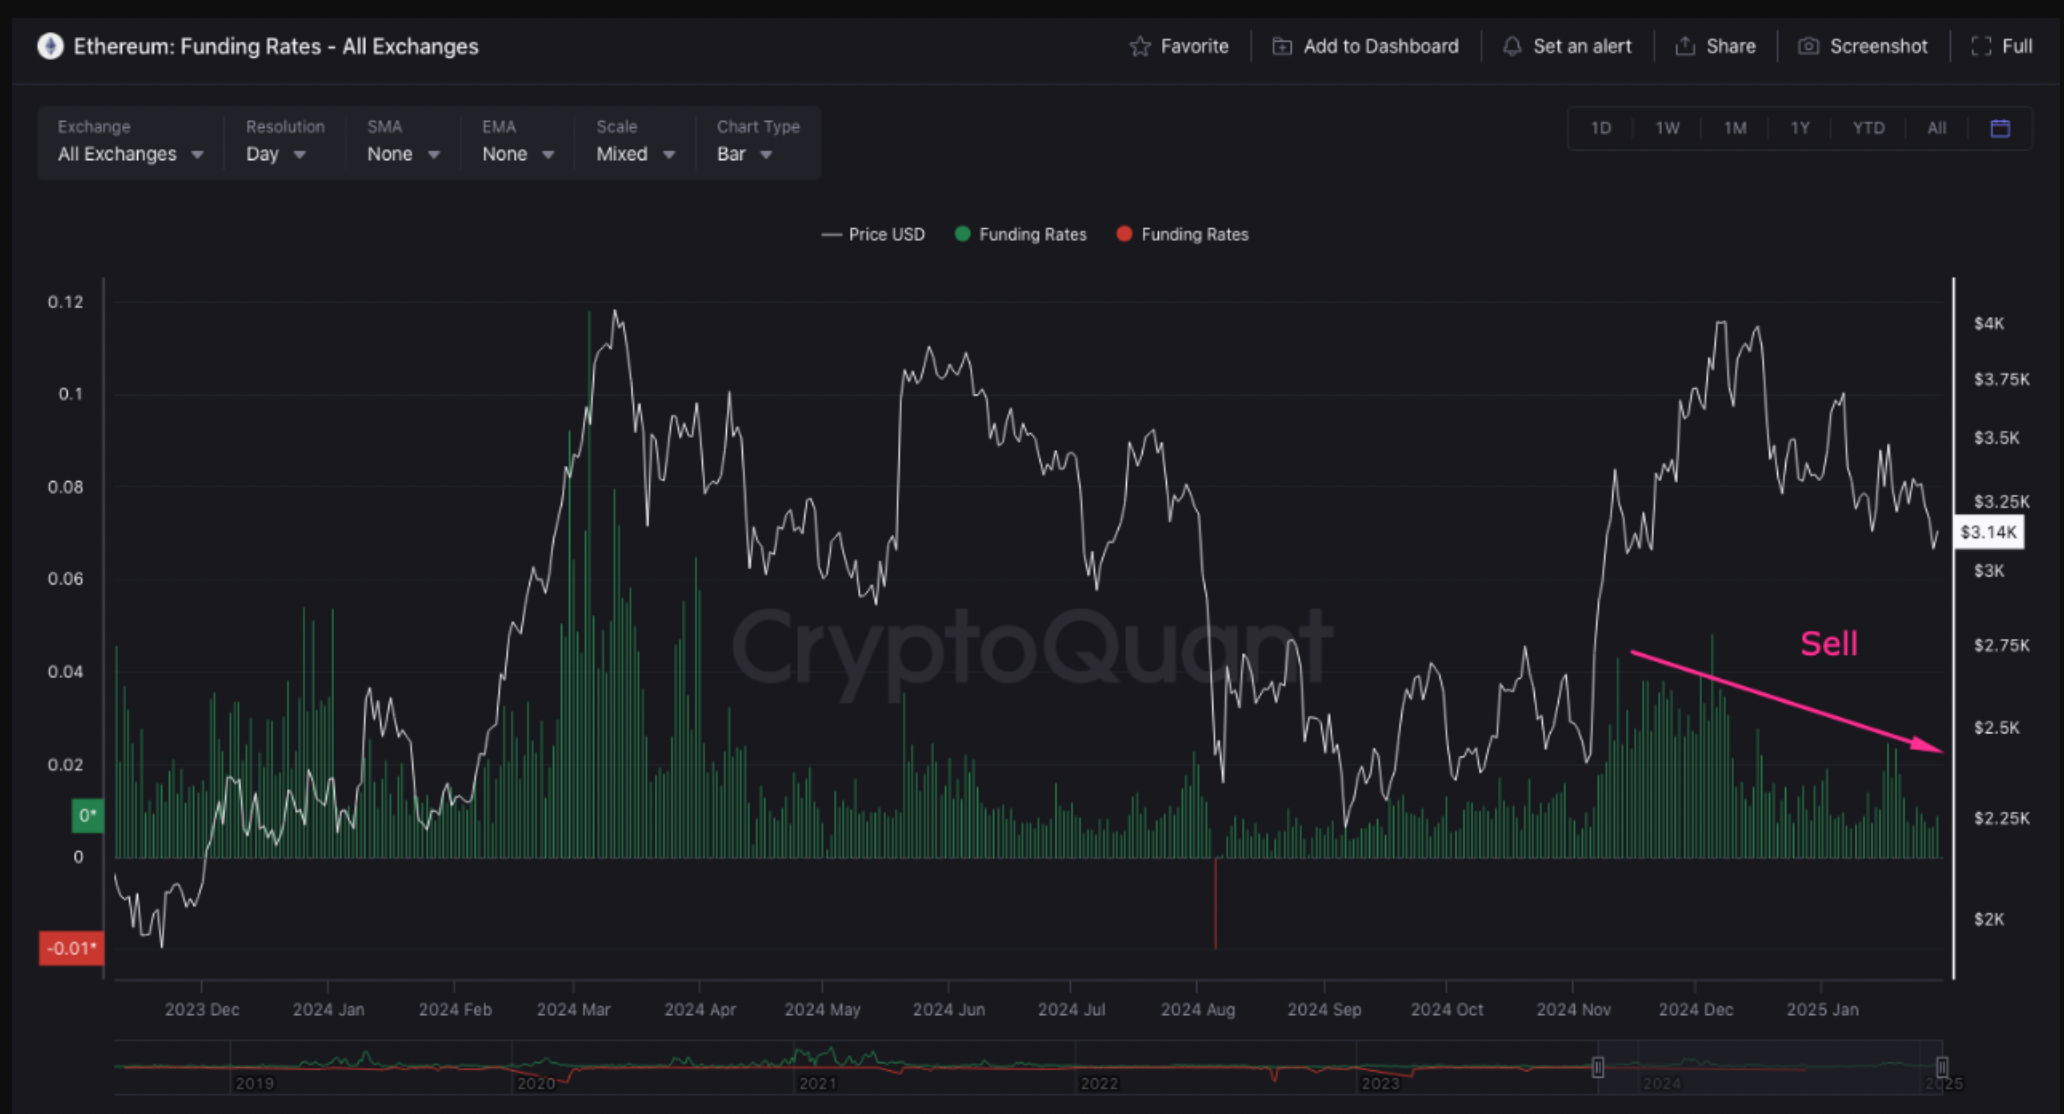
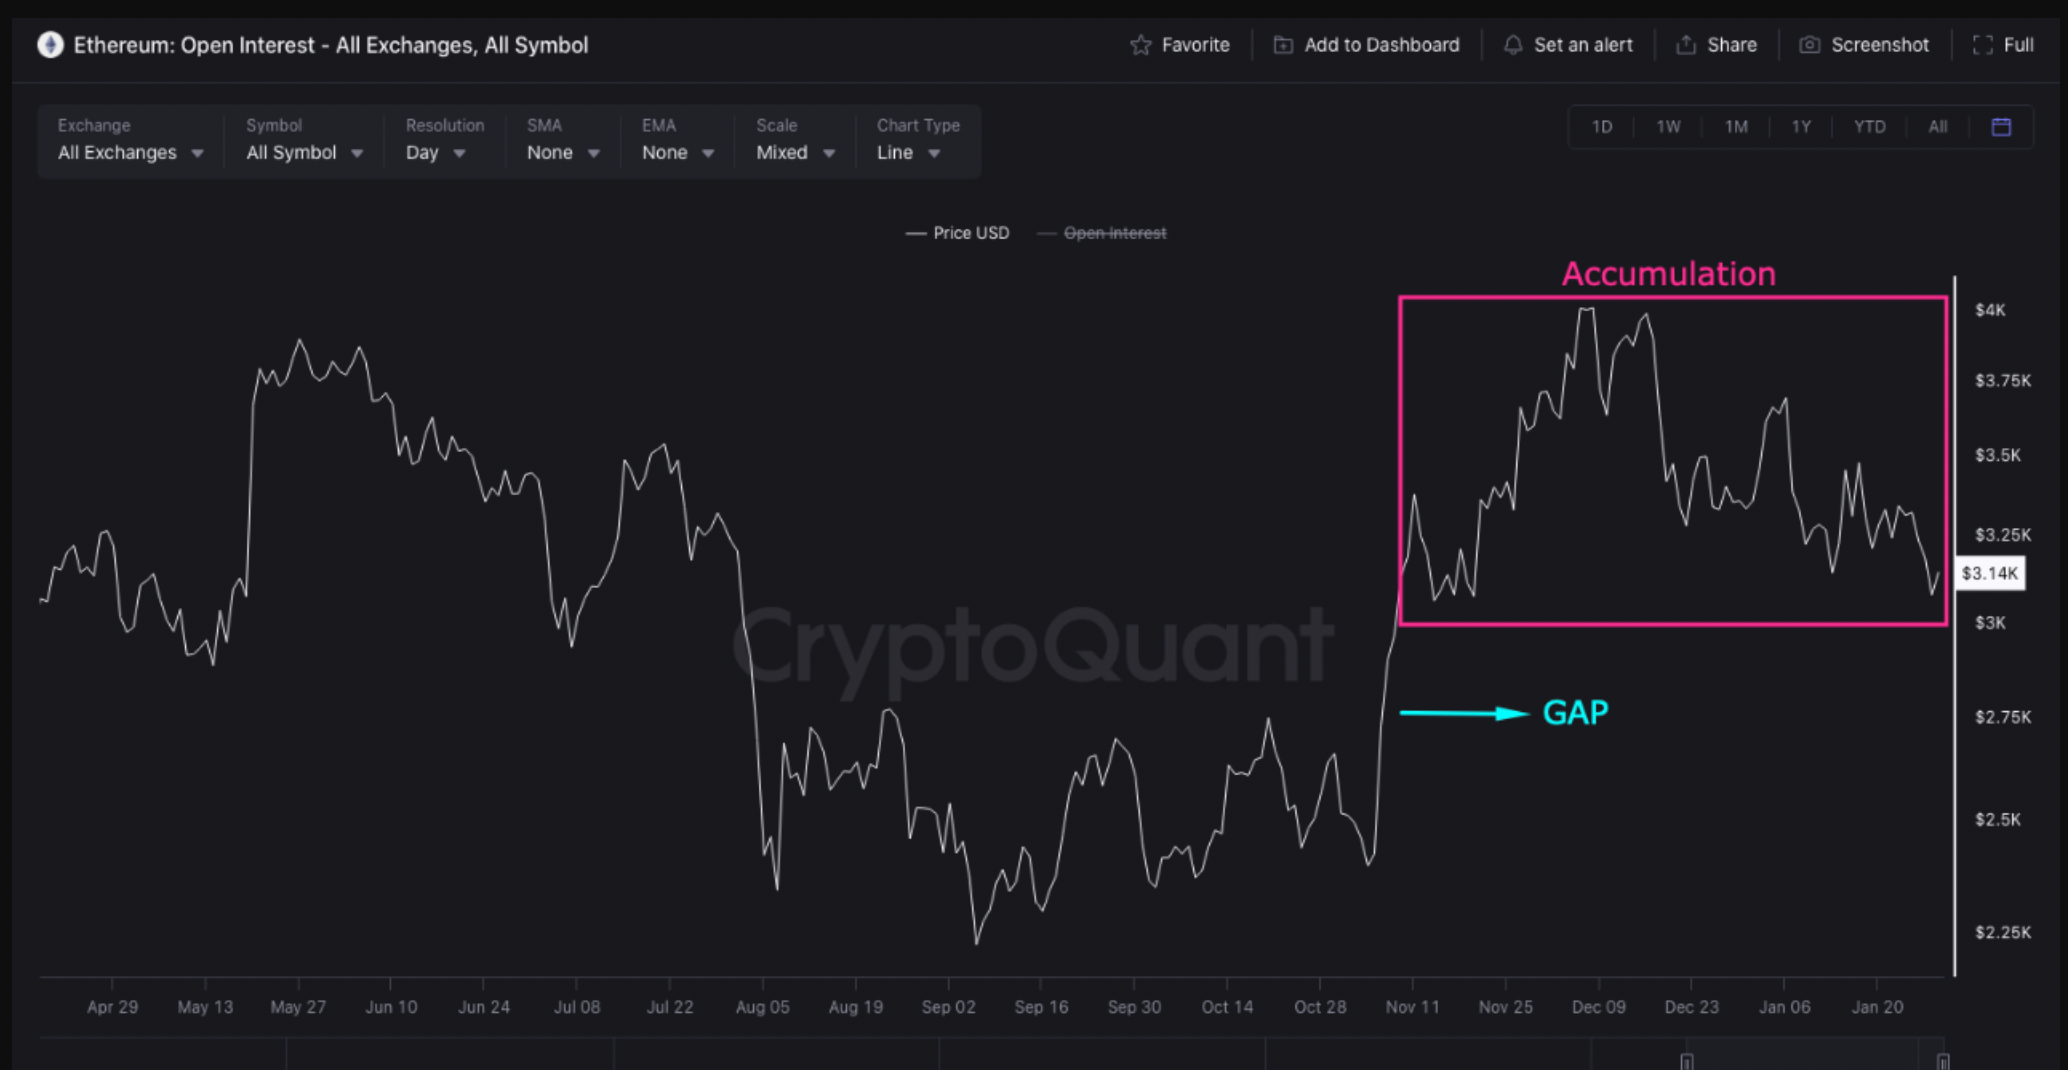
If ETH dips into this gap, it could trigger a cascade of liquidations for short sellers, leading to a rapid price reversal as traders rush to cover their positions. ETH could experience a strong rebound if this scenario unfolds, fueling a rally past resistance levels.
Ethereum MVRV Momentum Hits Level That Preceded 40% Correction
Despite the bullish outlook, analyst Ali highlighted a concerning metric—Ethereum’s Market Value to Realized Value (MVRV) ratio dropping below the 160-day moving average.
The MVRV ratio compares ETH’s current market price to the average price at which all ETH was last moved on-chain. A drop below the 160-day moving average signals that holders increasingly risk falling into losses, often triggering panic selling and corrections.
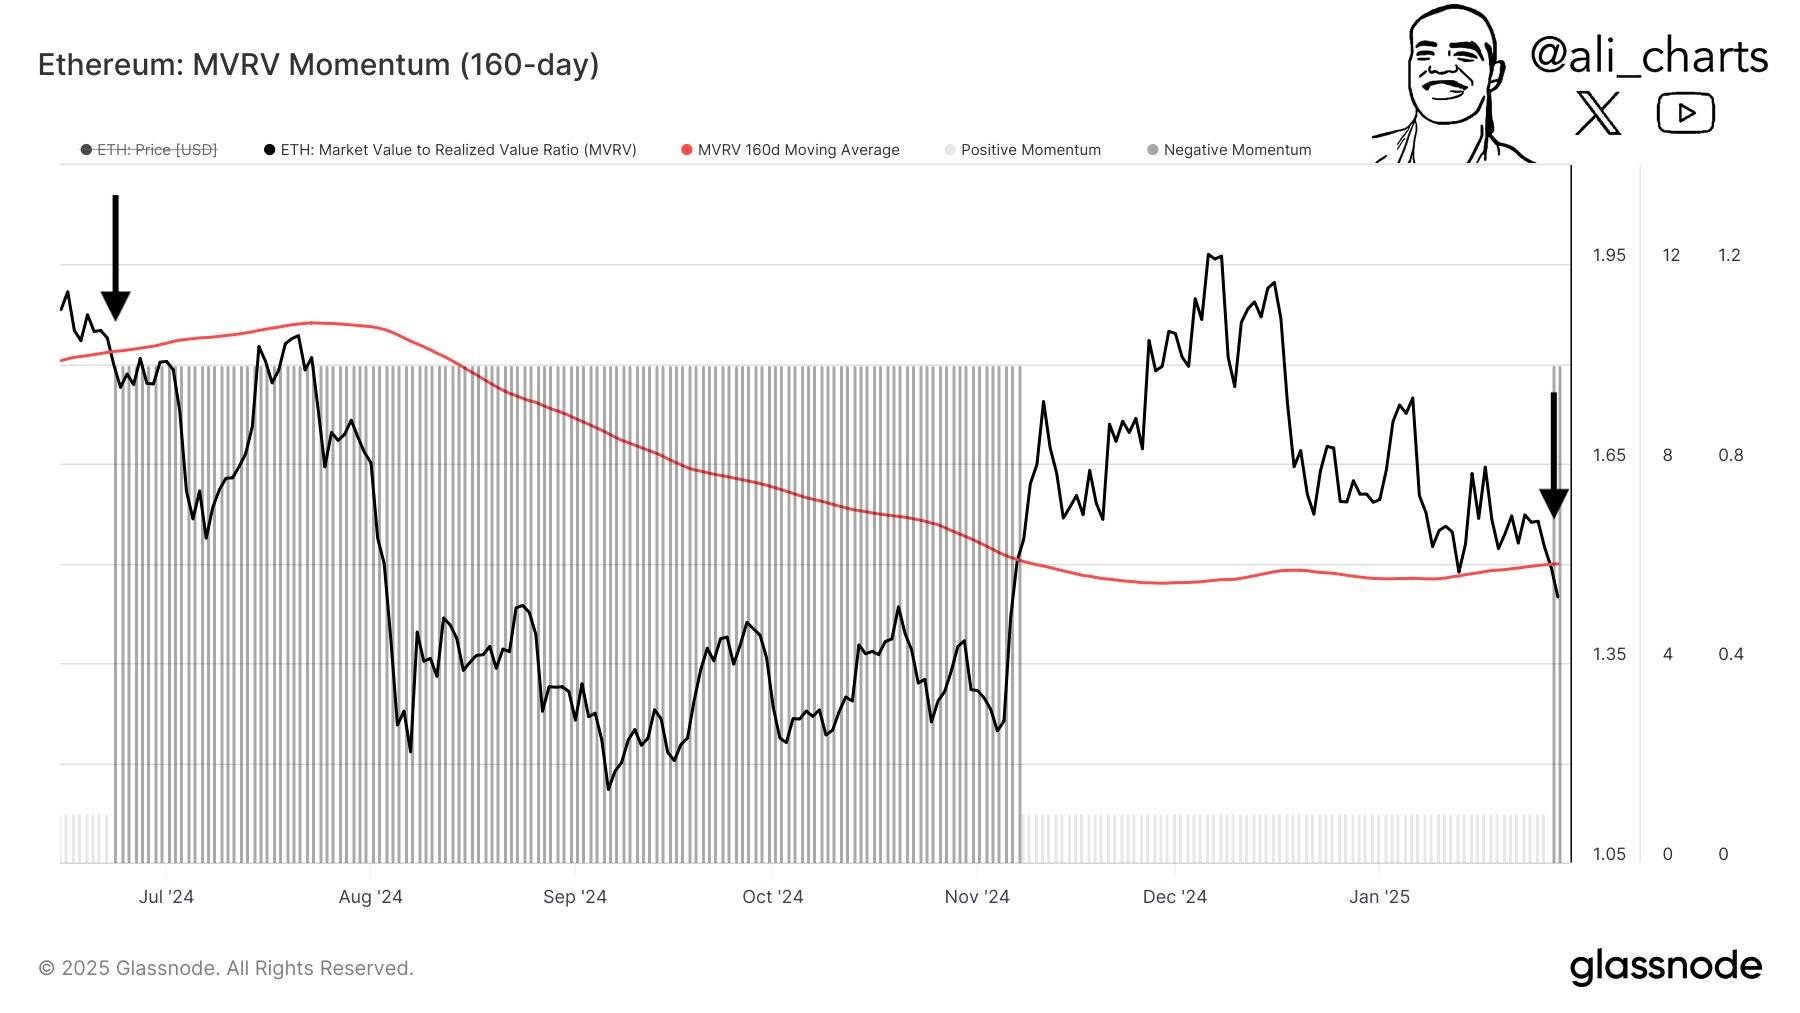
The last time this occurred, ETH plunged 40%, declining from $3,500 to $2,100.
While this pattern does not guarantee a repeat, traders should remain cautious, as short-term volatility may precede Ethereum’s next sustained uptrend.