


U.S. natural gas kicks off the Thursday session waiting for a new storage report, with the previously published figures showing a small national surplus to the seasonal average and a more uneven regional picture. EIA’s October 22 release put Lower 48 working gas at 3,644 billion cubic feet for October 16, following a 77 billion cubic feet weekly injection. Stocks were 35 billion cubic feet above the 5-year average and 152 billion cubic feet below the year earlier.
Storage Report Coming
Today’s storage update will be the main focus for the session. It is expected to be released at 10:30 a.m. Eastern. Accordingly, the prior 77 billion cubic feet injection must be compared to whether more or less gets introduced into storage. Distinguishing between the 2 comparison periods helps the fundamental picture. A market that holds less gas than a year ago while remaining above its 5-year seasonal norm still has compatible statements coming from the data, as they answer different questions about the starting cushion for the heating season.
Regions Vary
Regional figures add another wrinkle to the story. South Central storage stood at 1,125 billion cubic feet against a 5-year average of 1,165 billion cubic feet. The East and Midwest were above their respective seasonal averages, while South Central salt storage was 251 billion cubic feet versus an average of 295 billion cubic feet. The chart compares the regional stocks with the 5-year benchmarks for clarity.
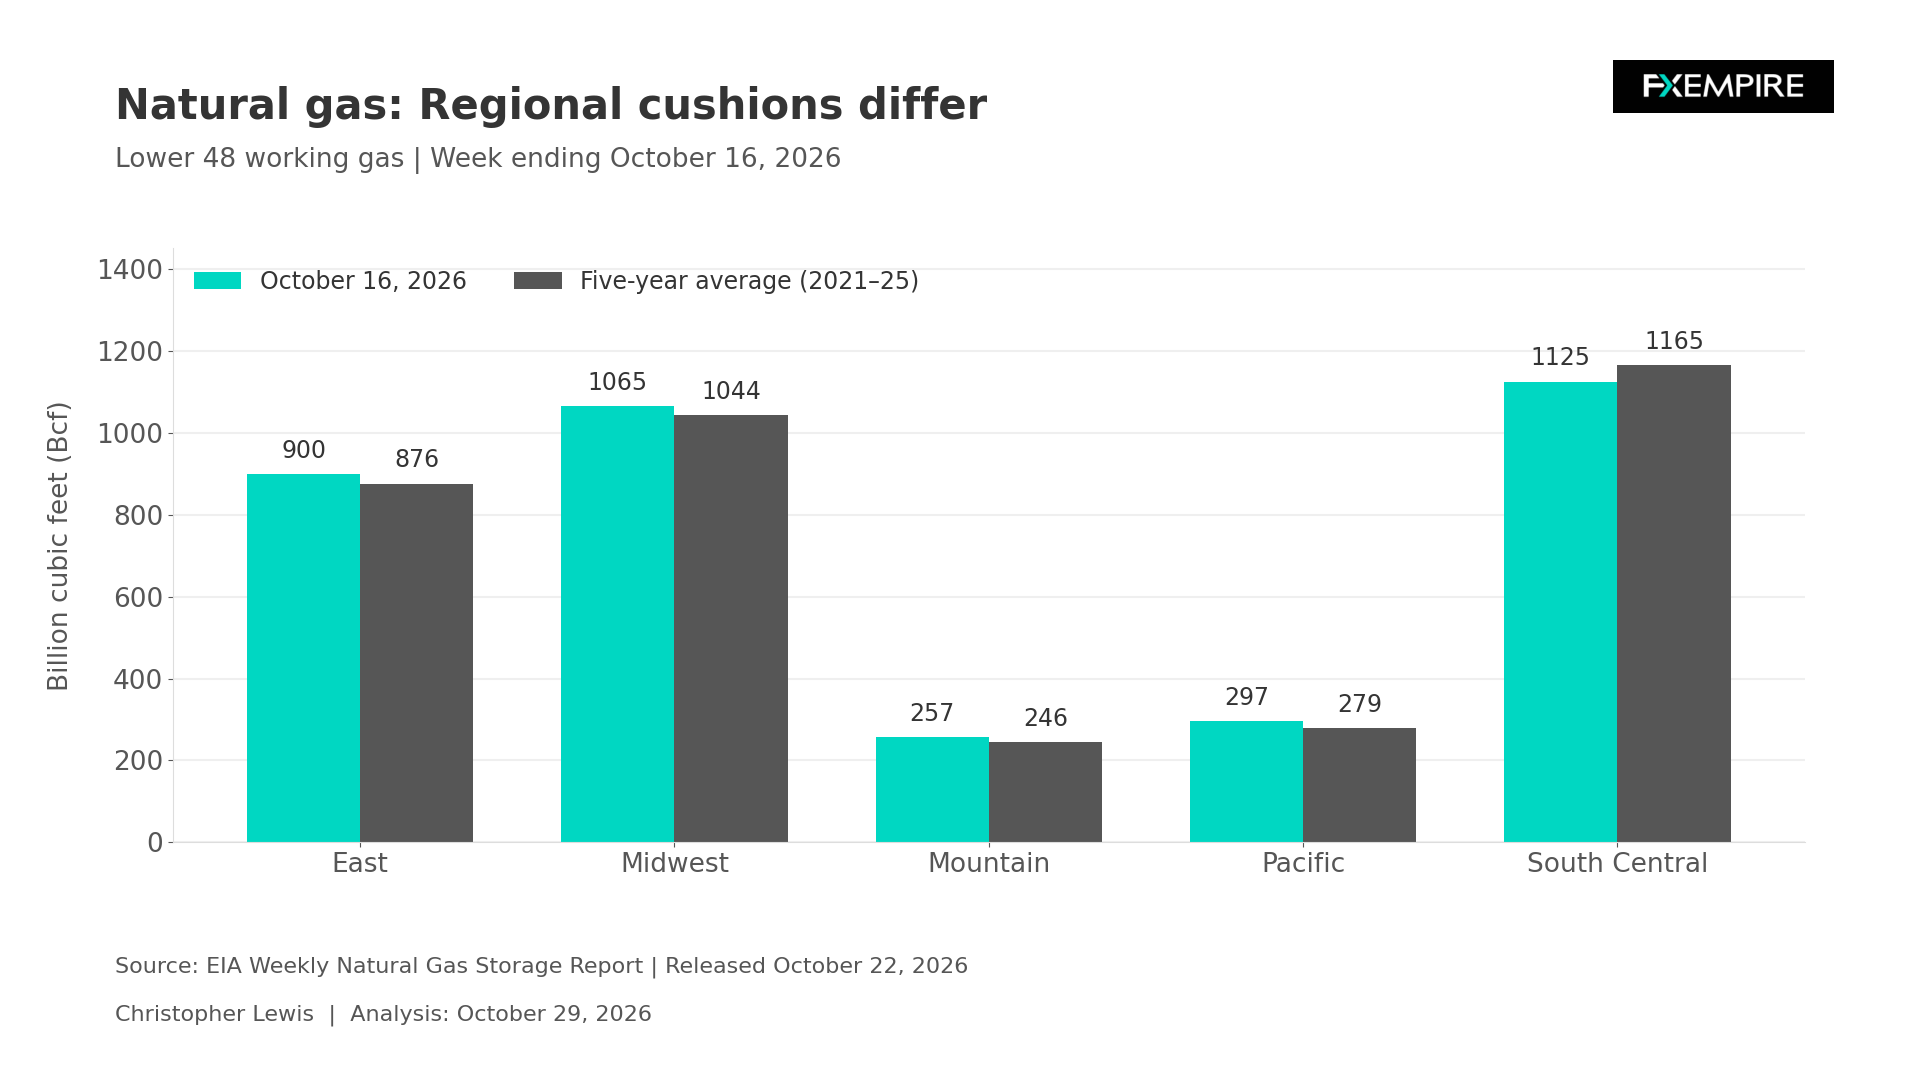
National Inventory Comfort Could Be Tested Against Location and Deliverability
Gas needs to be available where it is demanded, obviously, and have the infrastructure to move it. A nationwide surplus cannot by itself establish that each regional market has the same protection against a demand surge. Conversely, a regional shortfall to average is not proof of an immediate supply emergency.
EIA’s October Short-Term Energy Outlook
One of the EIA’s more telling reports was the October Short-Term Energy Outlook, projecting end-October inventories of 3,850 billion cubic feet, about 2% above the 5-year average. This forecast was completed on October 1 and released on October 6. It is a projection, not a measurement of stocks already accomplished.
Natural Gas Price Forecast
Every new Natural Gas analysis as it publishes, today's technical signal and key levels, live price — on one page.
See all Natural Gas forecastsThe same outlook forecast dry natural gas production averaging 112.20 billion cubic feet per day in 2026 and 116.13 billion cubic feet per day in 2027. LNG exports are projected at 17.6 and 18.6 billion cubic feet per day, respectively. The annual averages describe EIA’s expected balance and forecast. They do not take into account fresh news.
Can Supply Keep up With Demand?
For Henry Hub, the important question will be whether or not supply can keep pace with the combined call from domestic users and export facilities. LNG growth can add a durable source of demand, but the impact on storage depends on the supply response. Weather can also alter the trajectory. Heating demand rises with temperatures dropping, whereas the mild conditions that we have seen in the United States recently can allow injections to continue longer. As of late, NOAA has been forecasting warmer temperatures into the second week of November.
When the storage figures arrive later today, the total change, regional distribution, and updated comparison with the seasonal norm will all be major factors in determining the outlook. A smaller injection alone does not provide demand strength, nor can supply changes produce the same result. A larger injection simply needs context before modeling our trade.
The more constructive scenario for natural gas would involve the national cushion narrowing while the South Central position remains relatively tight and heating demand strengthens. The opposite scenario would be continued storage accumulation supported by supply growth and limited weather-driven demand.
Trading Gas
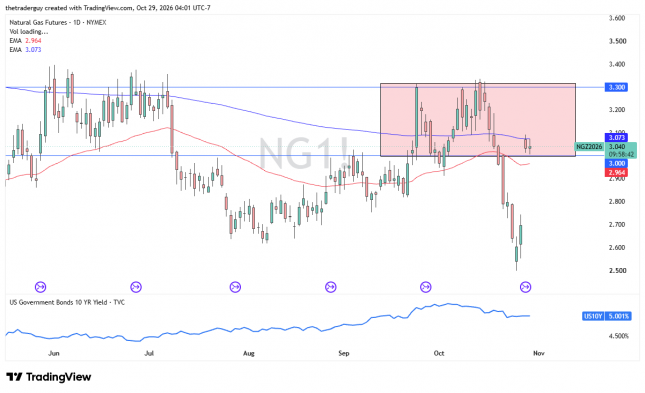
The technical look for natural gas is one that is pricing in the likelihood of higher pricing in December, but the gap was so intense and so large that, without some type of accompanying weather prediction, it is likely to see the market attempt to fill it. Thus, I am more of a buy-the-dip type of trader here, with an eye on the 50-day EMA, $2.90, and $2.80. If the market were to break above $3.10 on a daily close, then I would probably be a buyer and looking to reach the $3.30 level. All of these are conditional, and with the storage report coming out, volatility would be expected.
If you’d like to know more about how to trade natural gas, please visit our educational area.