


Inverse Head-and-Shoulders Signals Reversal
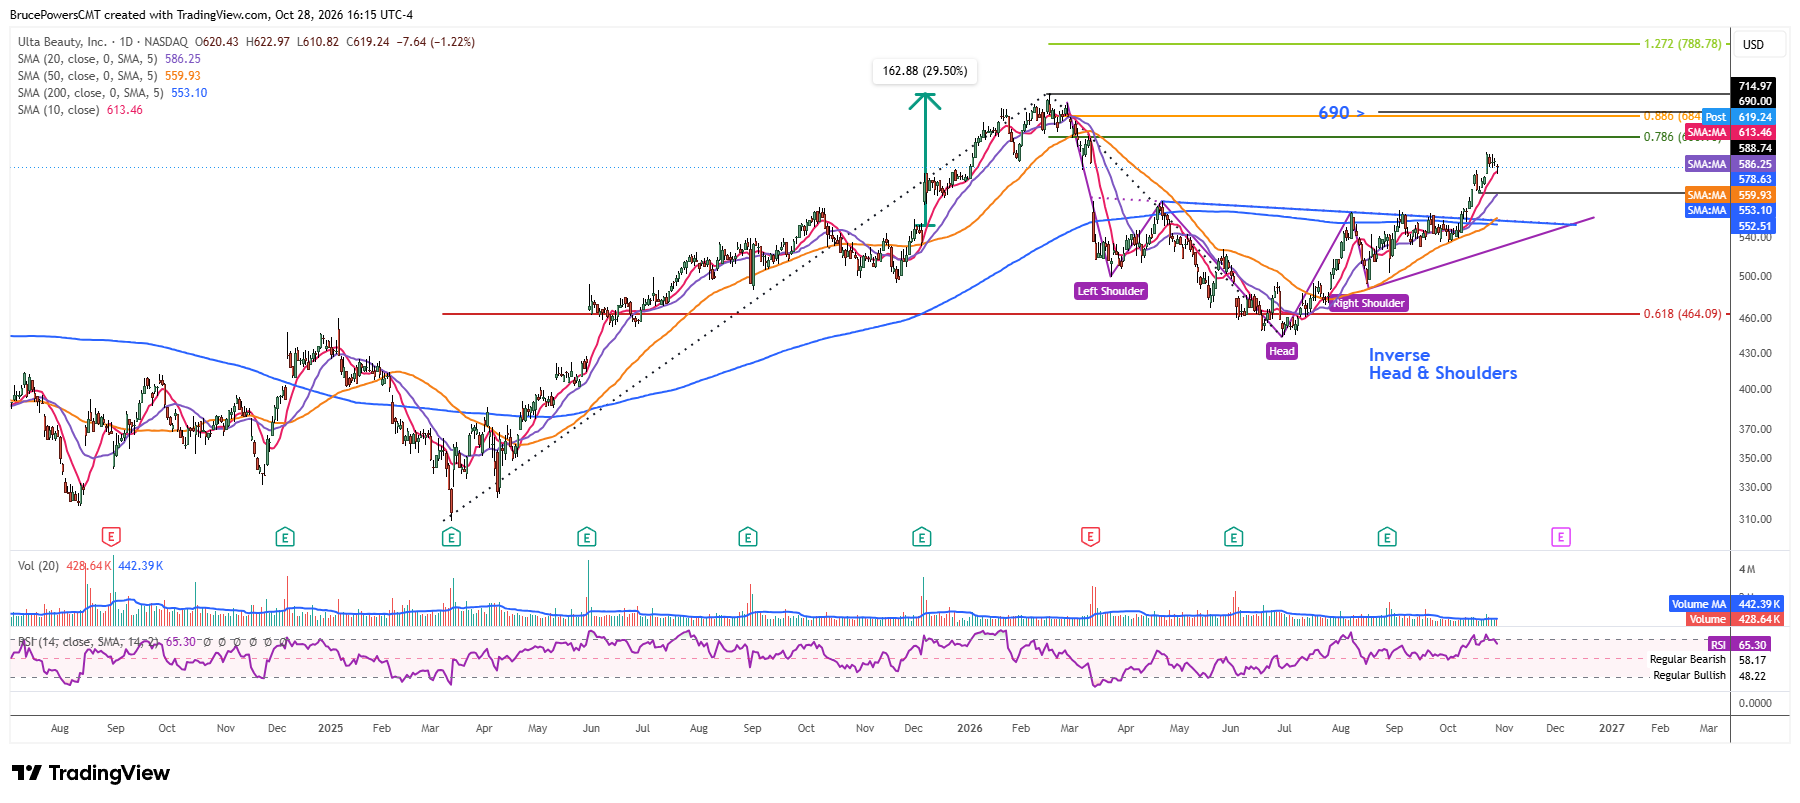
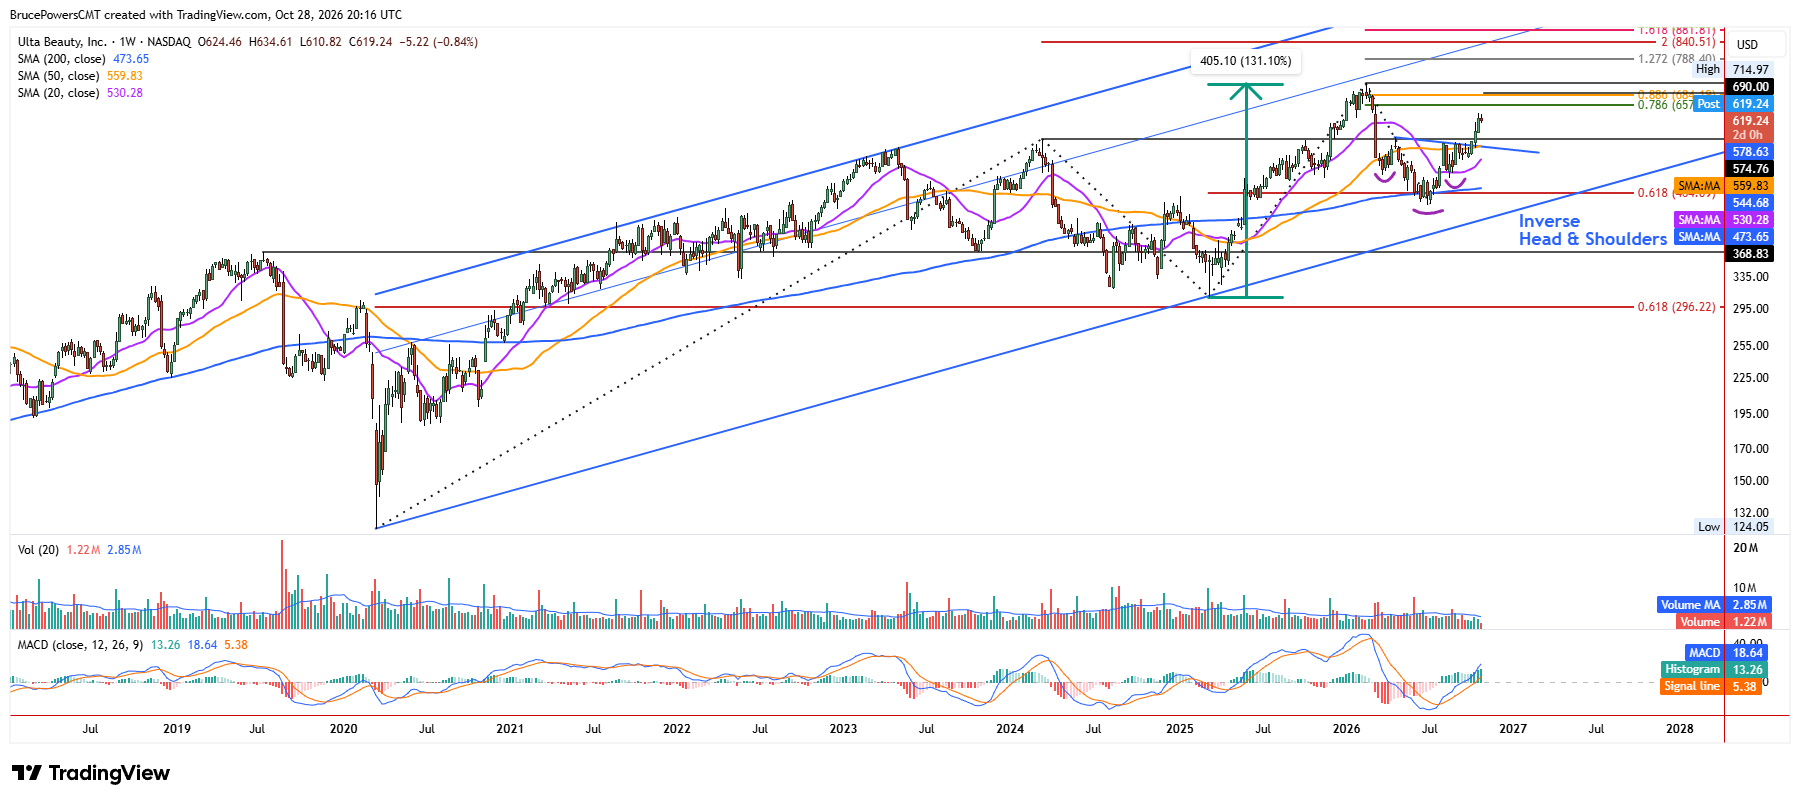
The stock of Ulta Beauty, Inc. (ULTA), a U.S. specialized beauty retailer, broke out of an inverse head-and-shoulders pattern three weeks ago, signaling a bullish reversal of the recent bearish correction. A higher swing low of $443.60 was established in June, near a 61.8% Fibonacci retracement of the prior advance, helping form the bullish reversal pattern.
Also, the long-term 200-week moving average was successfully tested as support during the decline, increasing the significance and potential sustainability of the higher swing low. as support. The significance of the upside breakout was reinforced by the reclaiming the 50-week moving average, as well as the 200-day moving average on the daily chart, during the same period.
First Pullback Could Create New Opportunities
The recent correction followed a long-term base breakout, which reached a high of $574.76 in December 2025. ULTA eventually reached a new record high of $714.97 before the bearish correction. This means that the first pullback following a long-term breakout has likely completed, adding to the significance of the inverse head-and-shoulders breakout.
In addition, following the pattern’s breakout ULTA reached a high of $637.26 and may have begun to show signs of the first potential pullback since that breakout. Certainly, that is not clear yet, as the trend could extend to the upside, but it some point a pullback will occur and it may result in new opportunities.
Short-term dynamic support is represented by the 10-day moving average near $613, which was tested as support on Wednesday with the day’s low of $610.82. That daily test identifies the moving average as well as a nearby structural support level at $610.81. Key levels to watch for possible support if a decline extends are the recent higher swing low at $588.74, along with the rising 20-day moving average near $586.
The 20-day moving average is on track to soon rise above the swing low and could become a more important support indicator. In addition, the swing low is also a higher weekly low, adding to its significance and the potential for support to be found during a pullback that holds above $588.74.
Support Levels Hold Key to Upside Targets
An upside measuring objective for the inverse head-and-shoulders pattern is approximately $690, with the 88.6% Fibonacci retracement of the prior decline at $684 providing additional confluence for this potential target zone. However, if the long-term bullish trend extends into new highs, Fibonacci extension targets suggest potential upside objectives at either the 127.2% Fibonacci extension at $788.88 or the 161.8% extension at $882.68. Fow now, ULTA’s ability to hold support during its first post-breakout pullback will be key. Holding support would keep the $690 target in focus, while a deeper decline toward $588.74 would test the bullish recovery.
If you’d like to know more about technical analysis and how traders use it, please visit our educational area.