



June U.S. Dollar Index futures overcame early session weakness to post a modest gain on Monday. The index was mainly supported by a weaker Euro which declined in reaction to weaker-than-expected German retail data. Disappointing U.S. personal income and pending home sales data, however, kept a lid on the index.
Daily Swing Chart Technical Analysis
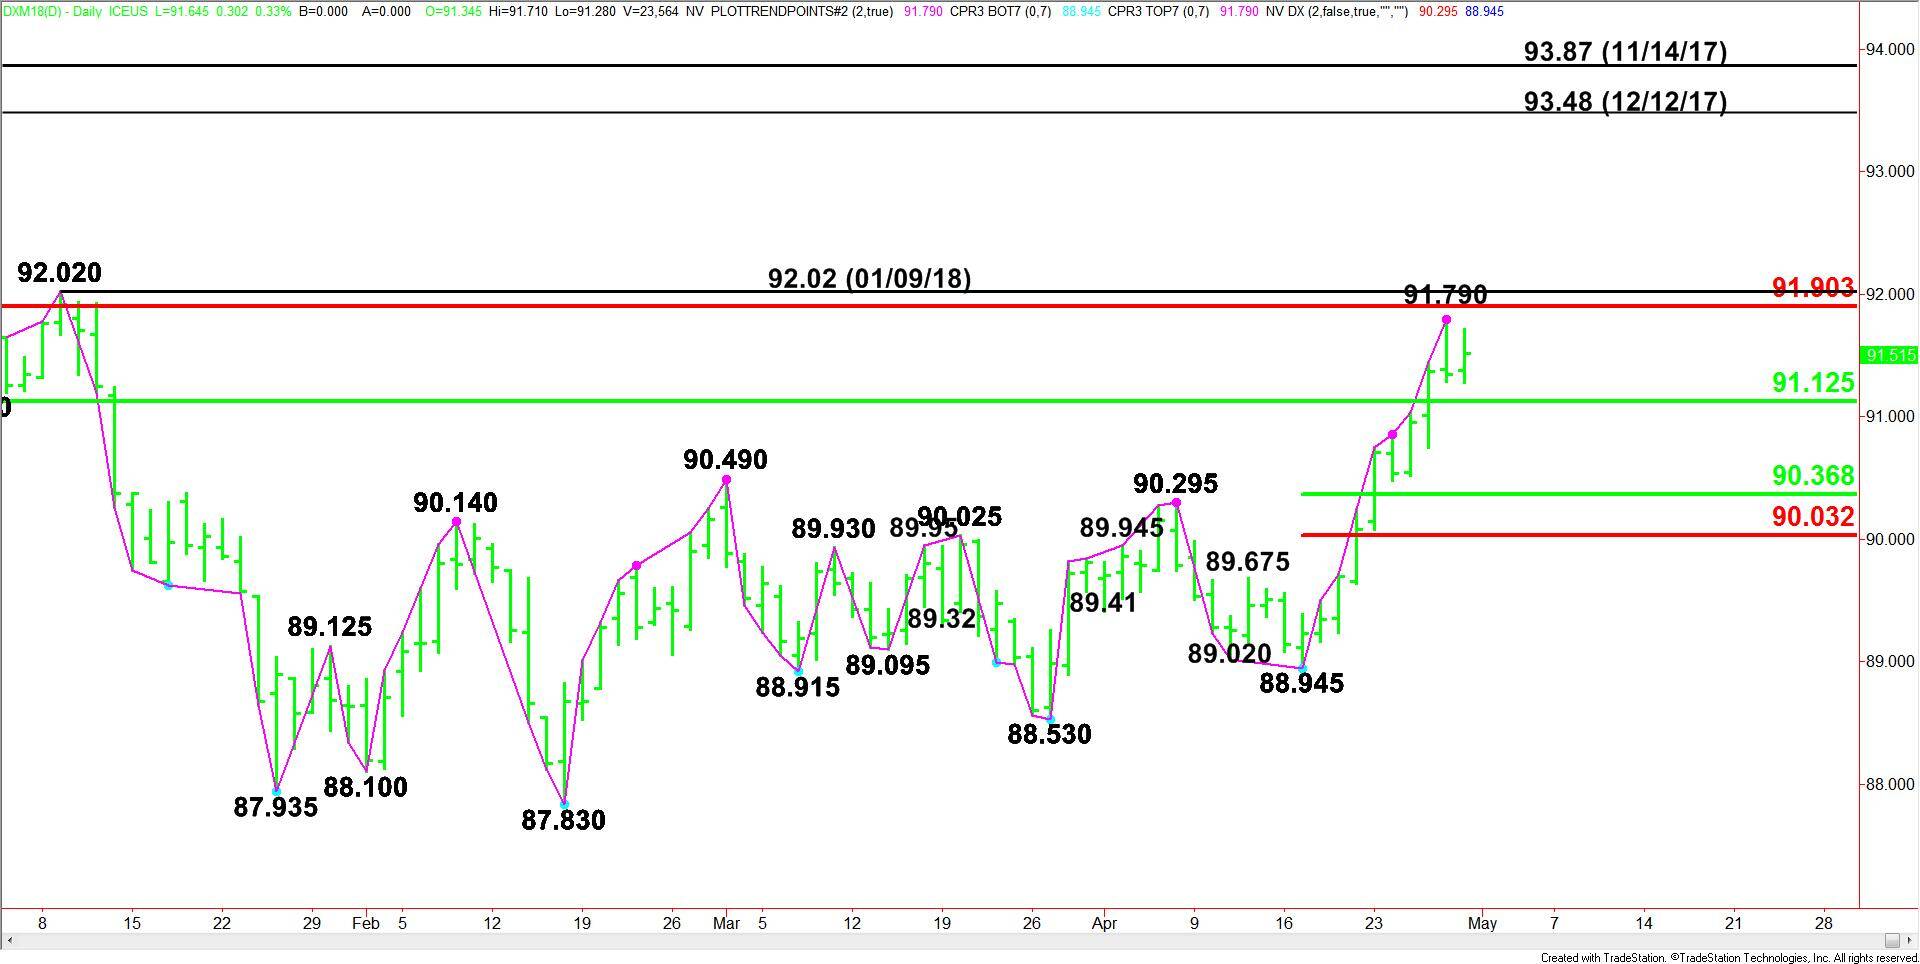
The main trend is up according to the daily swing chart. However, Friday’s closing price reversal top may have killed the upside momentum. The chart pattern was confirmed early Monday but the move wasn’t very convincing. Nonetheless, a new minor top was formed at 91.790 in the process.
A trade through 91.28 will indicate the return of sellers. A move through 91.790 will negate the chart pattern and signal a resumption of the uptrend. This could drive the index into the next main top at 92.02. This price is also the trigger point for a potential acceleration to the upside.
The main range is 94.42 to 87.83. Its retracement zone at 91.125 to 91.90 is currently being tested. Trader reaction to this zone will determine the longer-term direction of the index.
The short-term range is 88.945 to 91.790. If there is a further confirmation of the closing price reversal top then we could see a 2 to 3 day correction into its retracement zone at 90.37 to 90.03.
US Dollar Index Price Forecast
Every new US Dollar Index analysis as it publishes, today's technical signal and key levels, live price — on one page.
See all US Dollar Index forecastsDaily Swing Chart Technical Forecast
The near-term direction of the dollar index will be determined by how traders react to the reversal top at 91.79 and yesterday’s low at 91.28.
To take it a step further, we may need a breakout over 92.02 to sustain the rally, and a break down under the main 50% level at 91.125 to sustain a short-term correction. Otherwise, we could just sit in a range.
The first sign that buyers have returned will be a move through 91.79. Taking out 91.90 will indicate the buying is getting stronger. Breaking out over 92.02 will reaffirm the uptrend. The latter is a potential trigger point for an acceleration to the upside with 93.48 the next likely target over the near-term.
A sustained move through 91.28 will indicate the selling is greater than the buying at current price levels. This could trigger a fast break into the main 50% level at 91.125. This is a potential trigger point for an acceleration into the short-term retracement zone at 90.37 to 90.03.