



June U.S. Dollar Index futures spiked to the upside last week to its highest level since January. The rally was fueled by rising U.S. Treasury yields and expectations for further rate hikes later this year.
Weekly Swing Chart Technical Analysis
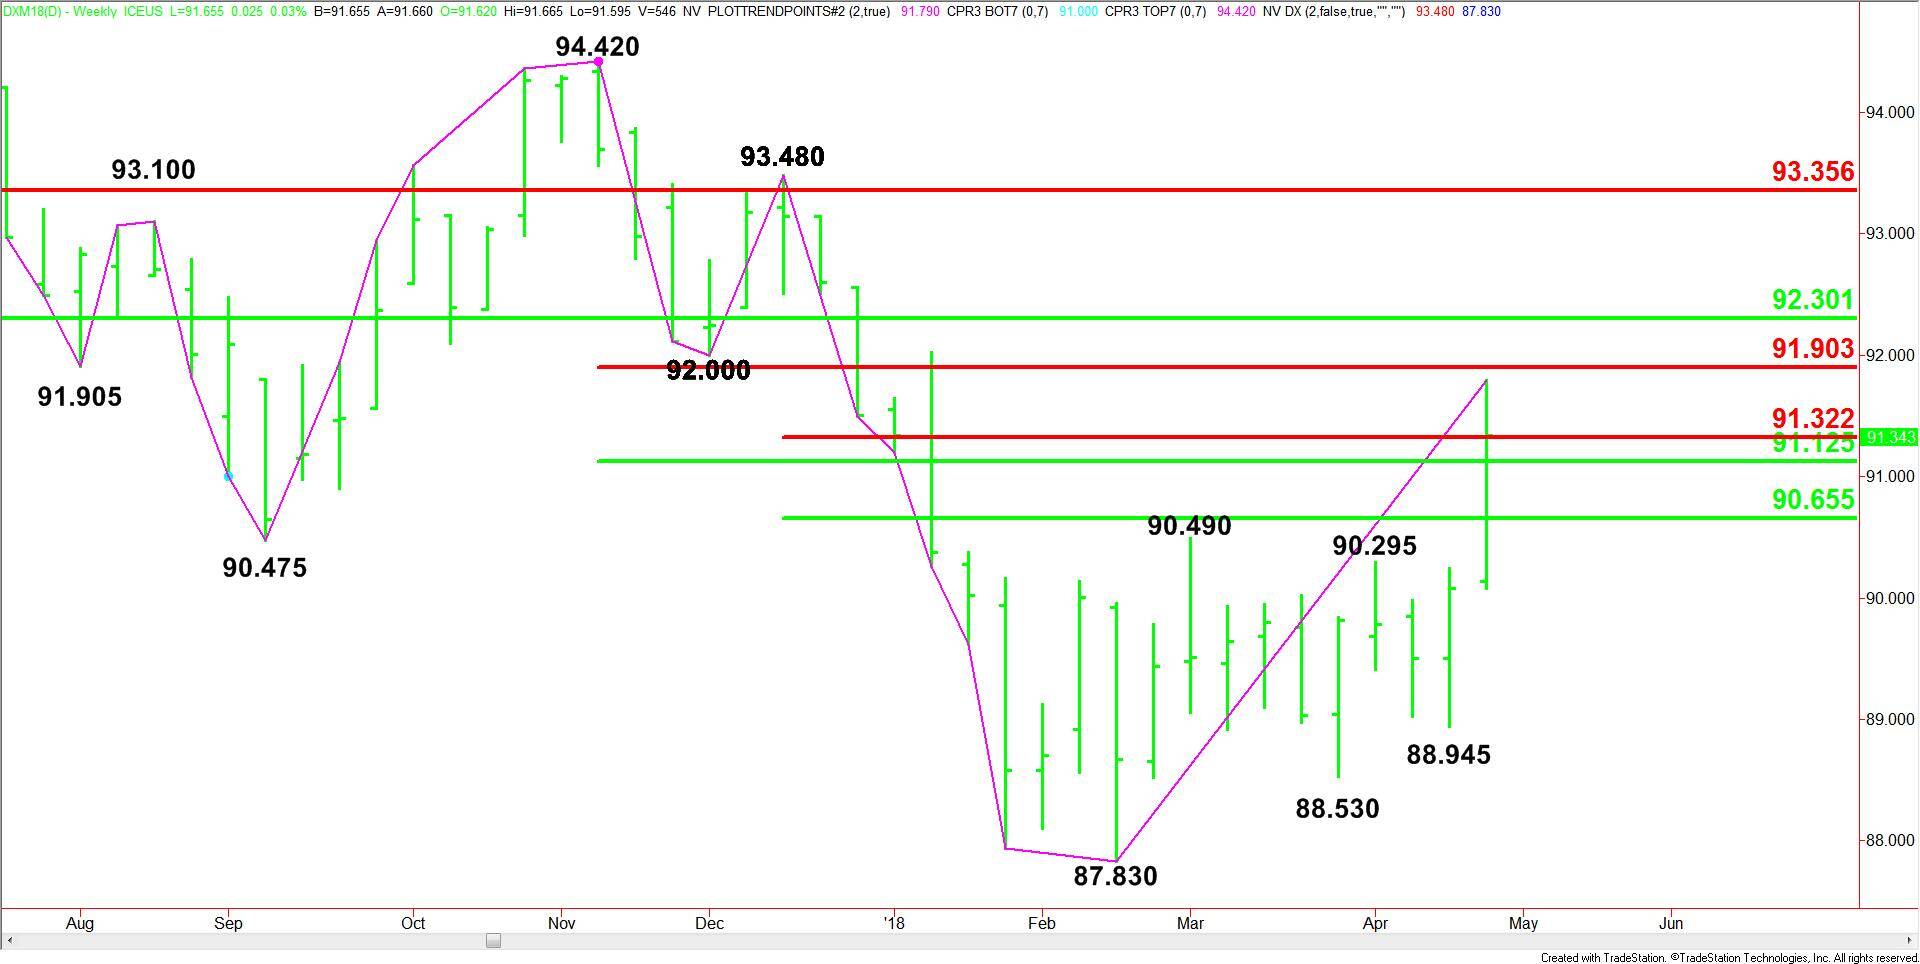
The main trend is down according to the weekly swing chart. However, momentum is trending higher following the breakout to the upside of a nine week range.
The main trend will change to up on a move through 93.48.
The minor trend is up on the weekly chart. A trade through 88.945 will change the minor trend to down.
The price action is being controlled by a series of retracement levels.
The major long-term retracement zone at 92.301 to 93.356 is the primary upside target. Seller could show up on the first test of this level.
The main range is 94.42 to 87.83. Its retracement zone at 91.125 to 91.90 is currently being tested. Trader reaction to this zone will likely determine the near-term direction of the index.
The short-term range is 93.480 to 89.830. The market is currently trading on the strong side of its retracement zone at 90.655 to 91.32, giving the index an upside bias.
US Dollar Index Price Forecast
Every new US Dollar Index analysis as it publishes, today's technical signal and key levels, live price — on one page.
See all US Dollar Index forecastsWeekly Swing Chart Technical Forecast
Based on last week’s close at 91.34, the direction of the June U.S. Dollar Index this week will be determined by trader reaction to the short-term Fibonacci level at 91.32.
A sustained move over 91.32 will indicate the presence of buyers. This could create the upside momentum needed to challenge the main Fibonacci level at 91.90. This is the last potential resistance level before the major 50% level at 92.30.
A sustained move under 91.32 will signal the presence of sellers. This could lead to a quick test of the 50% level at 91.125.
If 91.125 fails as support, the index could continue to weaken into the next 50% level at 90.655. Look for a technical bounce on the first test of this level.
We could see a sharp break if 90.655 fails as support.