
Advertisement
Advertisement
US Dollar Index (DX) Futures Technical Analysis – October 20, 2014 Forecast
By:
December U.S. Dollar Index futures posted another inside move on Friday, indicating trader indecision, but setting up the index for a volatile move.
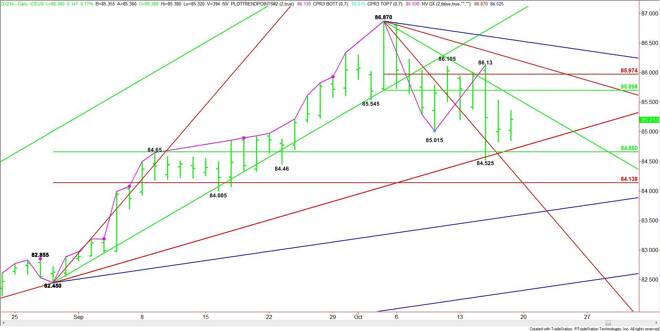
December U.S. Dollar Index futures posted another inside move on Friday, indicating trader indecision, but setting up the index for a volatile move. Traders are waiting for news to launch the next move and could sit inside a tight range until Wednesday when the U.S. releases its latest data on retail sales and consumer inflation.
The first support is a long-term uptrending angle at 84.76. This angle is moving up from the July 1 bottom at 79.885 so breaking it with strong volume will indicate a shift in investor sentiment. This could lead to an eventual break into the next uptrending angle at 83.61.
The main range is 82.45 to 86.87. The retracement zone formed by this range is 84.66 to 84.14. This zone stopped the rally last week when the index traded down to 84.525. Since the main trend is down on the daily chart, counter-trend buyers may step in when this zone is being tested.
On the upside, the first target is a downtrending angle at 85.50. The short-term range is 86.87 to 84.525. Its retracement zone at 85.70 to 85.97 is the next key upside target. Since the main trend is down, sellers may step in following a test of this range.
Downtrending angles at 86.18 and 86.53 are also potential upside targets should the retracement zone fail to stop a rally.
Look for a bearish tone if 84.76 is taken out with conviction and a bullish tone on a sustained move over 85.50. Even if the angles are broken, traders have to be careful trading weakness under 84.76 because of the retracement zone at 84.66 to 84.14, or buying a breakout over 85.50 because of the zone at 85.70 to 85.97. Read the order flow and watch the price action.
About the Author
James Hyerczykauthor
James Hyerczyk is a U.S. based seasoned technical analyst and educator with over 40 years of experience in market analysis and trading, specializing in chart patterns and price movement. He is the author of two books on technical analysis and has a background in both futures and stock markets.


Advertisement