



December U.S. Dollar Index futures are trading higher shortly before the regular session opening, however, the market has given up most of its earlier gains, suggesting the rally has run out of buyers.
There are no major reports today so investors may use this as an excuse to book profits and begin squaring positions ahead of Wednesday’s speech by Fed Chair Janet Yellen and Friday’s U.S. Non-Farm Payrolls report.
Daily Technical Analysis
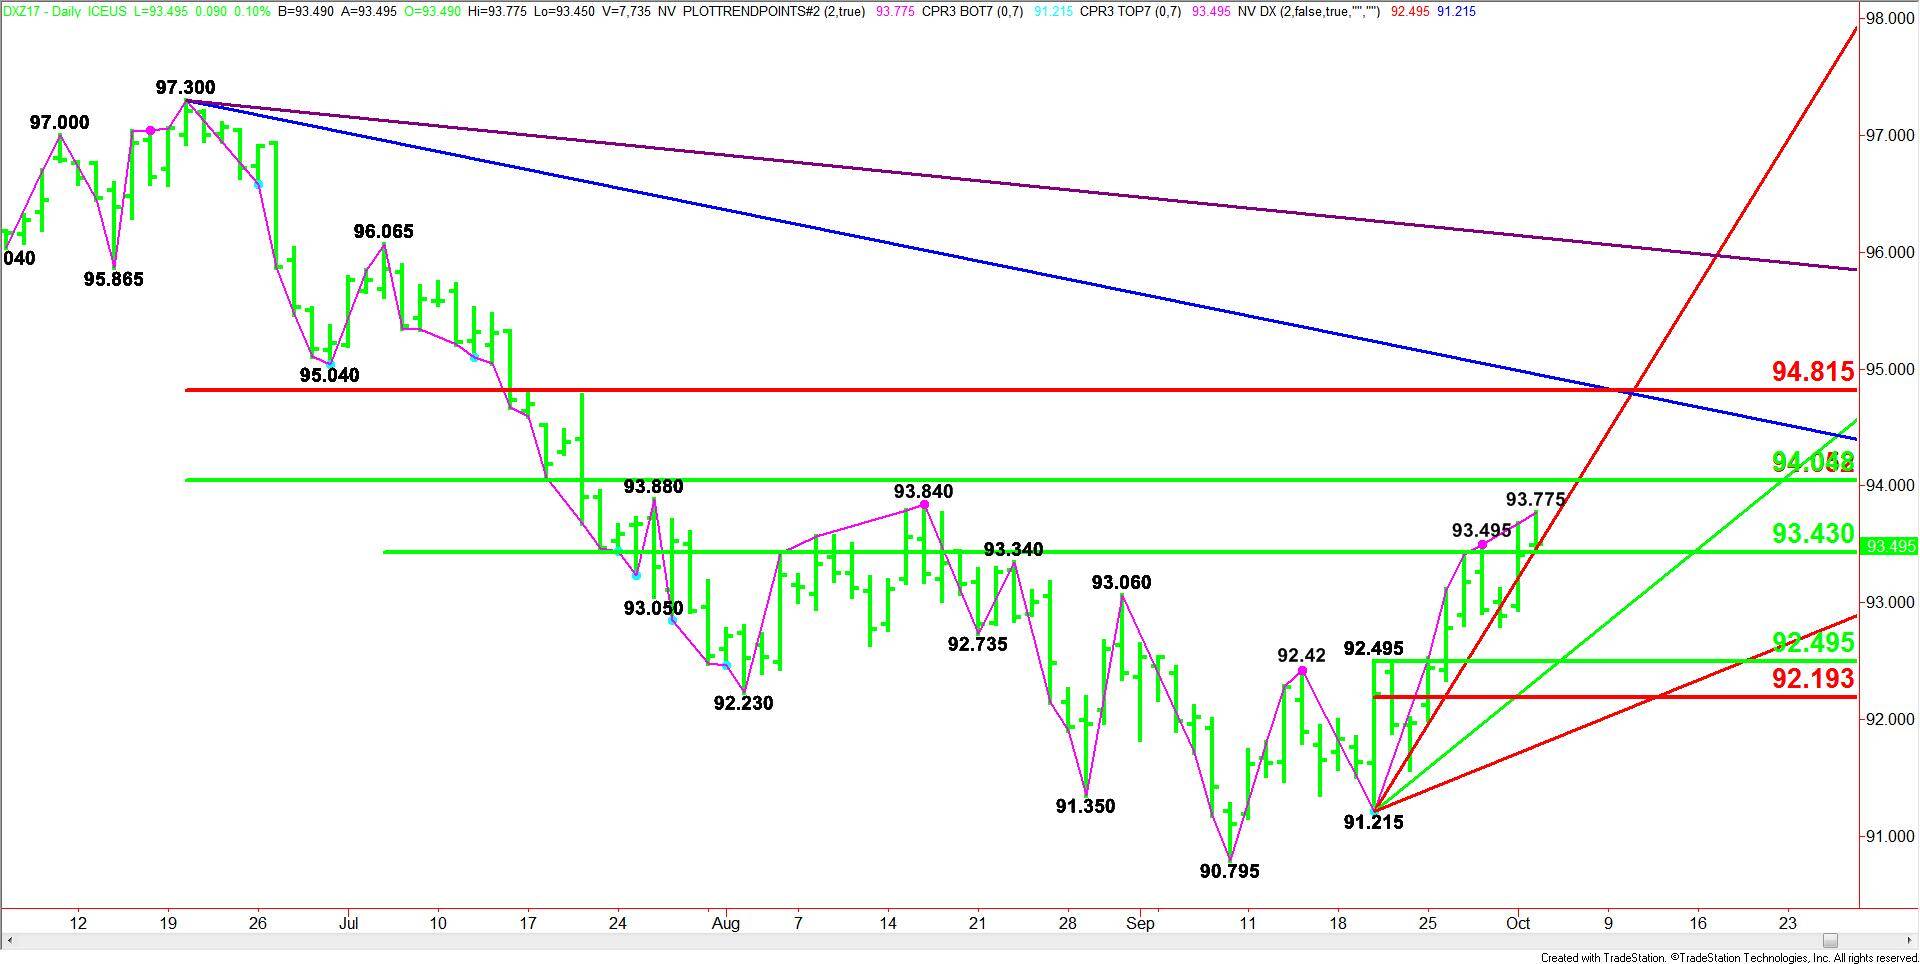
The main trend is up according to the daily swing chart. The market is also testing a retracement zone and it is in the “window of time” for a closing price reversal top. This doesn’t mean we’re getting ready for a change in trend, but we could see a 2 to 3 day pullback into a value zone.
The price action is currently be dictated by a pair of retracement zones at 93.43 to 94.05 and 94.05 to 94.815. Combining the two retracement zones makes 94.05 the key number. As long as the index remains under 94.05, we can build a case for a short-term downside bias.
The new short-term range is 91.215 to 93.775. If there is a correction then its retracement zone at 92.495 to 92.19 will become the primary downside target.
Daily Forecast
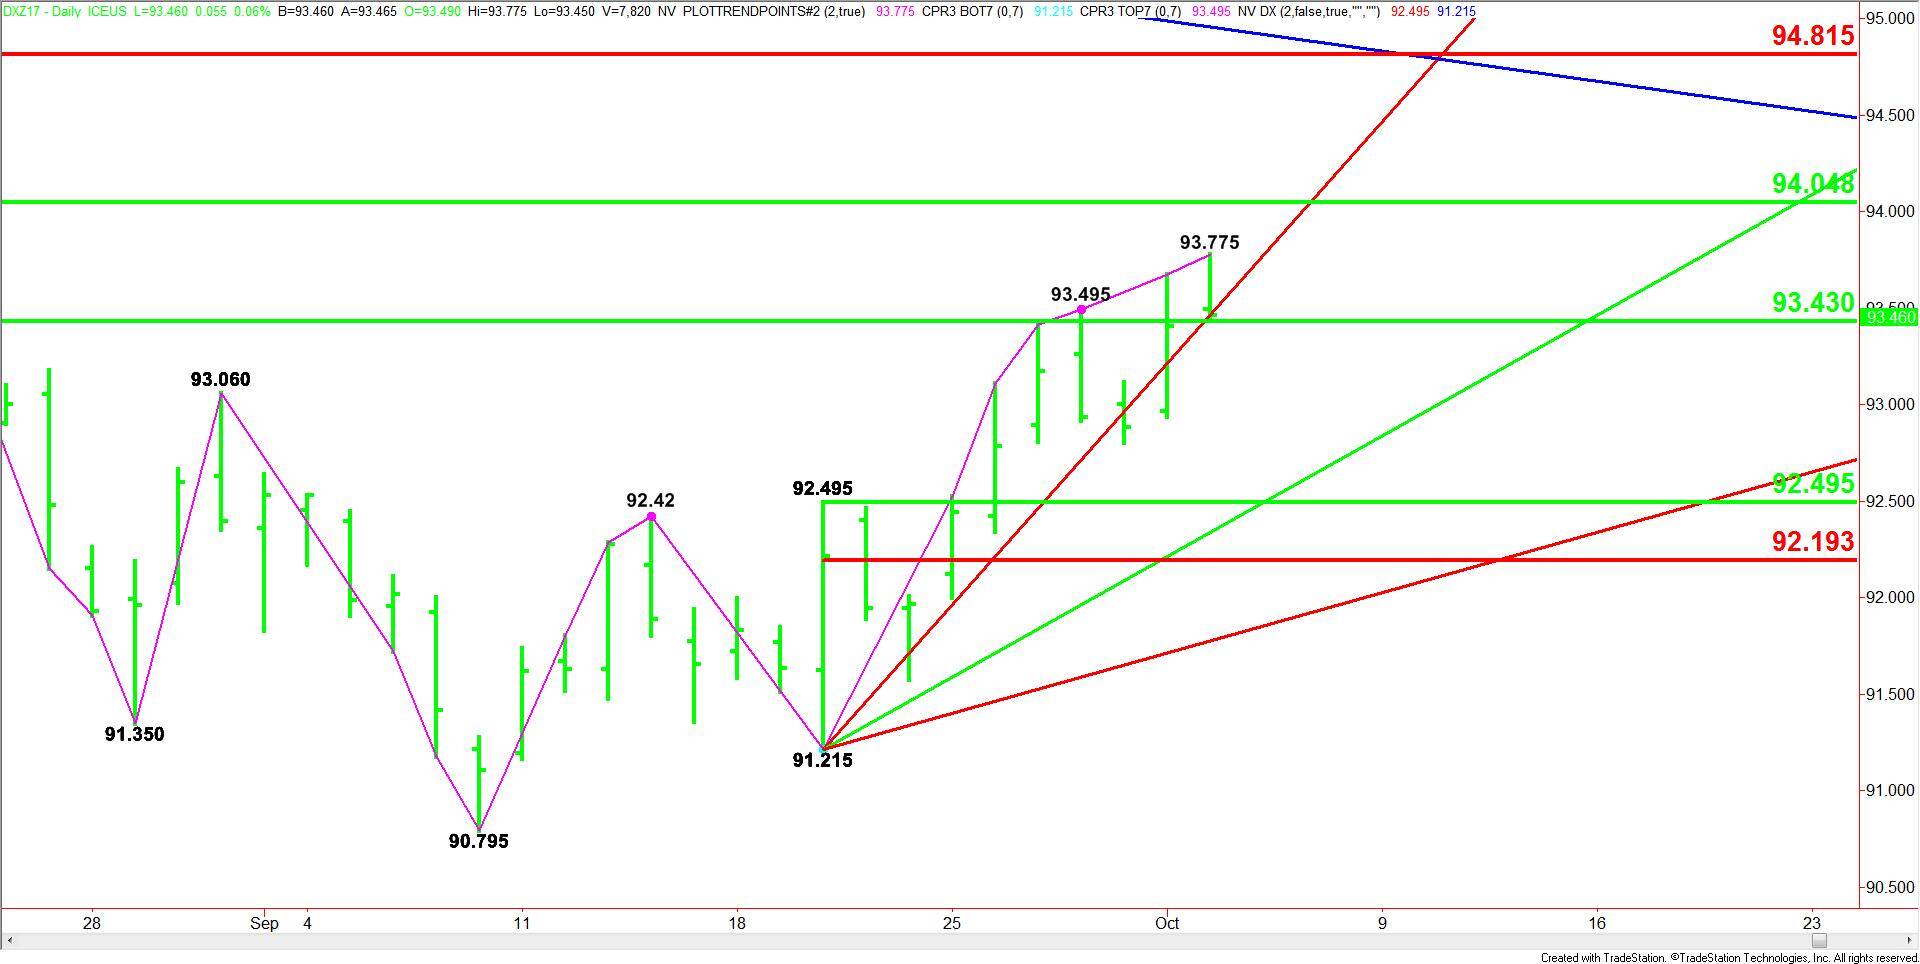
Based on the current price at 93.47 (1024 GMT) and the earlier price action, the direction of the index the rest of the session will be determined by trader reaction to the support cluster at 93.47 to 93.43.
US Dollar Index Price Forecast
Every new US Dollar Index analysis as it publishes, today's technical signal and key levels, live price — on one page.
See all US Dollar Index forecastsA sustained move over 93.47 will indicate the presence of buyers. They are defending yesterday’s close. If the buying is strong enough, we could see a retest of today’s intraday high at 93.775 and a pair of main tops at 93.84 and 93.88.
Overtaking 93.88 will indicate the buying is getting stronger with the major pivot at 94.05 the next target. This is also the trigger point for an acceleration to the upside with 94.815 the next target.
A sustained move under 93.43 will signal the presence of sellers. The daily chart is wide open under this angle so be prepared for a sharp sell-off with the next targets 92.495 to 92.34.
Look for an upside bias on a sustained move over 93.47 and for a downside bias to develop on a sustained move under 93.43.