


December U.S. Dollar Index futures are under pressure on Tuesday, driven lower by a surge in the Euro which represents about 57 percent of the index. A drop in U.S. Treasury yields is also contributing to the dollar’s weakness. Yields were under pressure amid position-squaring ahead of today’s speeches by Federal Open Market Committee members Neel Kashkari and Robert Kaplan.
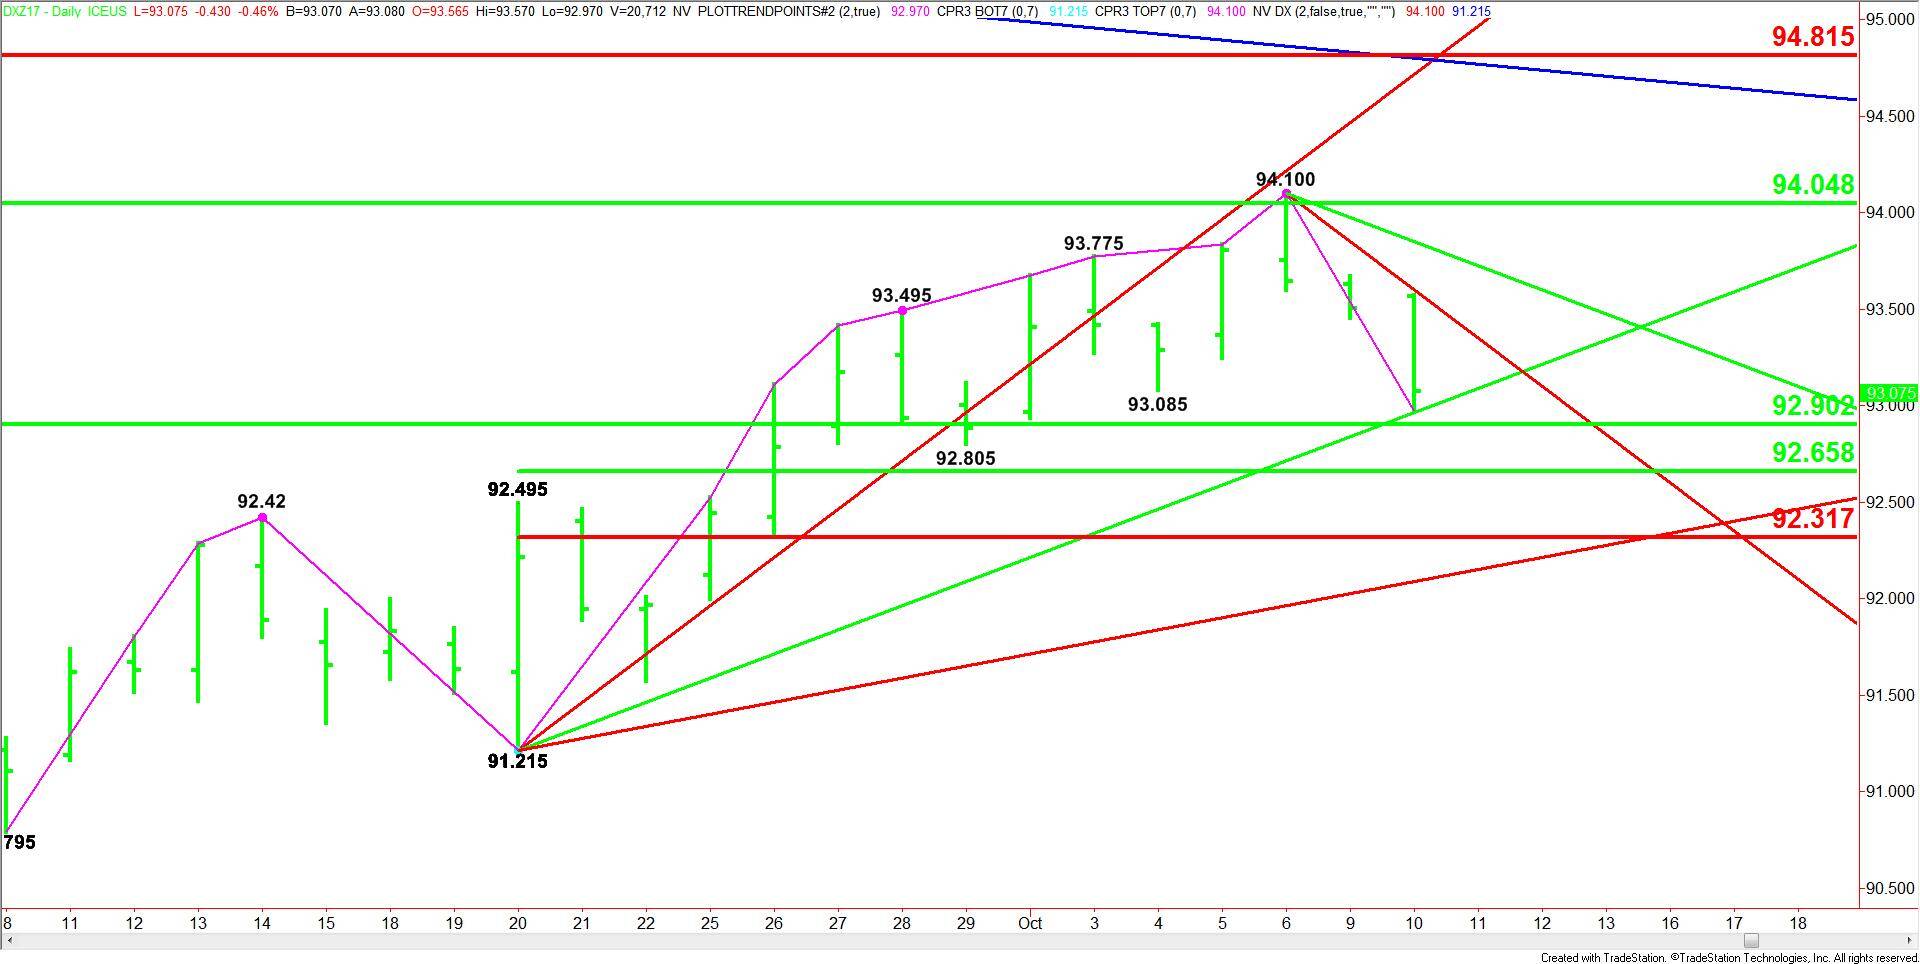
The main trend is up according to the daily swing chart, however, momentum shifted to down with the formation of a potentially bearish closing price reversal top. This chart pattern doesn’t mean the trend is changing to down, but is a strong indication that the selling is greater than the buying at current price levels. It often leads to the start of a 2 to 3 day correction equal to 50% to 61.8% of the last rally.
The main range is 91.215 to 94.100. Its retracement zone at 92.66 to 93.32 is the primary downside target. Since the main trend is up, we could see a technical bounce on the initial test of this area.
Additional support is a major 50% level at 92.90.
US Dollar Index Price Forecast
Every new US Dollar Index analysis as it publishes, today's technical signal and key levels, live price — on one page.
See all US Dollar Index forecastsEarlier today, the index found resistance at a downtrending Gann angle at 93.60. This generated enough downside momentum to drive the index into an uptrending Gann angle at 92.97. We could see a technical bounce later today on a test of this angle.
If the angle at 92.97 fails as support then look for the selling to continue into the main 50% level at 92.90. This is a potential trigger point for an acceleration into 92.66 then 93.32.
The current weakness comes as no surprise since the index was overbought. Additionally, there were no economic reports on Monday or Tuesday so long investors used this as an excuse to cut positions ahead of Wednesday’s Fed minutes, Thursday’s produce inflation data and Friday’s consumer inflation report.