



The dollar carried its five-day winning run into a sixth day early on Tuesday, touching its highest since April 2, 2025, when President Donald Trump rolled out his tariffs, Reuters reported. The dollar index, which tracks the greenback against six major currencies, hit 103.69 on bets for more aggressive Fed tightening following last week’s hot inflation data and hawkish central bank rhetoric, before easing to 103.49.
Dollar: Hike Bets Keep the Rally Going
Traders see a Fed hike in December as a certainty, and bets on a larger half-point move stand at around 5%, according to CME FedWatch, Reuters said. “Continued AI-related capital inflows and expectations of faster Fed tightening should support the USD,” said Carol Kong, economist and currency strategist at CBA, though she warned that “erratic US policymaking and a sharp correction in AI-related equities pose key downside risks.”
US retail sales are due later on Tuesday, and Nvidia’s earnings later in the day will test AI sentiment. Minutes of the Fed’s October 27 to 28 meeting follow on Wednesday.
Euro: ECB Hike Bets Fail to Help
The euro slipped to a fresh 19-month low of $1.0983, Reuters said. Eurostat’s second estimate on Friday confirmed that euro zone GDP grew 0.4% in the third quarter, slower than 0.6% in the second. All 71 economists in a Reuters poll taken November 10 to 12 expect the ECB to raise its deposit rate to 2.75% in December, and most of them see that as the peak.
That has not helped the euro. In my view, one ECB hike does little to close the gap with a Fed that is still tightening, and that gap is what is driving EUR/USD lower.
EUR/USD Price Forecast
Every new EUR/USD analysis as it publishes, today's technical signal and key levels, live price — on one page.
See all EUR/USD forecastsPound: Jobless Rate Falls, Pay Growth Slows
Sterling fell to $1.3169 before rebounding slightly, Reuters said. Office for National Statistics data on Tuesday showed UK unemployment fell to 4.6% in the three months to September, down 0.3 percentage points on the quarter and below the 4.7% Brown Brothers Harriman had expected. Regular pay growth, excluding bonuses, slowed to 3.5% from 3.7%. October inflation follows on Wednesday and is forecast to rise to 3.6% from 3.5%, according to Brown Brothers Harriman.
Last week’s data showed the UK economy grew 0.7% in the third quarter. Even so, I think the pound needs more than strong UK data to turn while US hike bets keep rising. The Bank of England’s next decision is on December 17.
US Dollar Index Technical Analysis: DXY Pulls Back From 103.75 as 103.21 Support Comes Into Focus
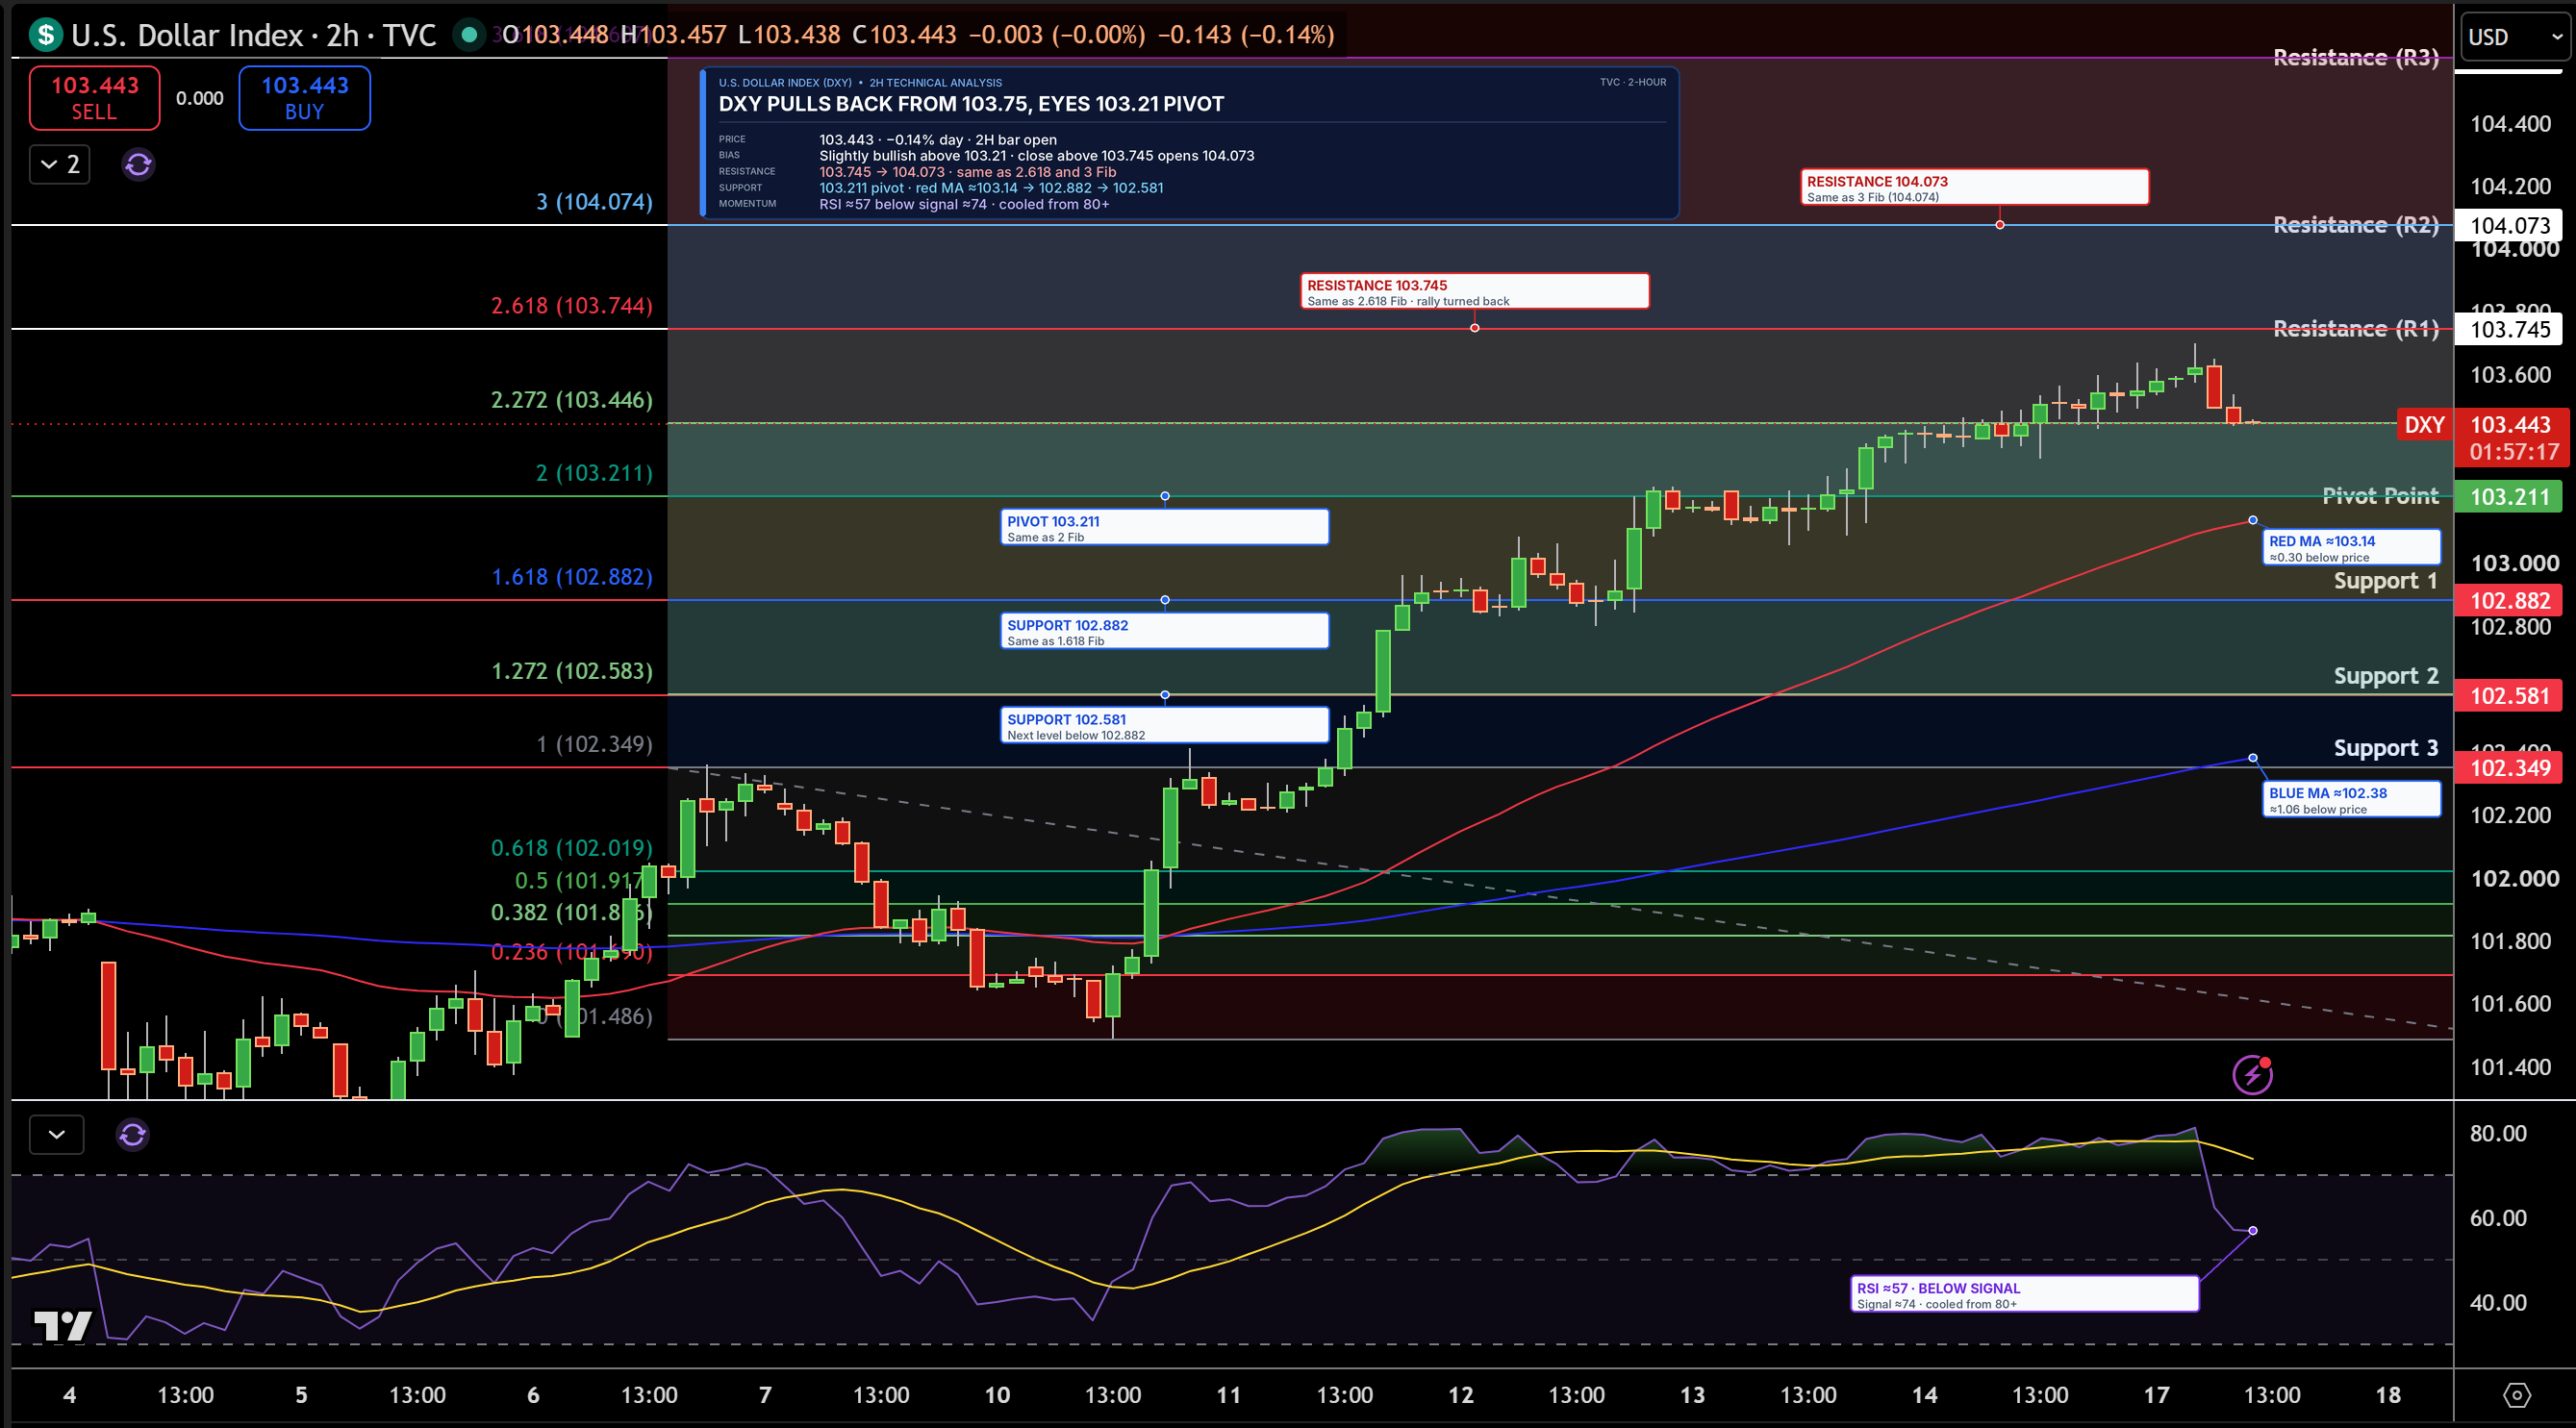
The US Dollar Index is trading near 103.44 on the 2-hour chart. The rally was turned back just below 103.75, and DXY is now easing toward 103.21, the pivot point, a level calculated from the previous period’s high, low and close that traders use to judge direction. The index remains above both moving averages, which track average prices over time, so the broader uptrend is intact.
Support, where buyers may step in, is 103.21, then 102.88. Resistance, where sellers may return, is 103.75, then 104.07. RSI, a 0 to 100 gauge of buying and selling strength, has cooled to about 57 from overbought and crossed below its signal line, a slower average of RSI. I lean slightly bullish while DXY holds 103.21. A close above 103.75 would open 104.07.
EUR/USD Technical Analysis: Euro Holds 1.1000 but Stays Below 1.1058 Pivot
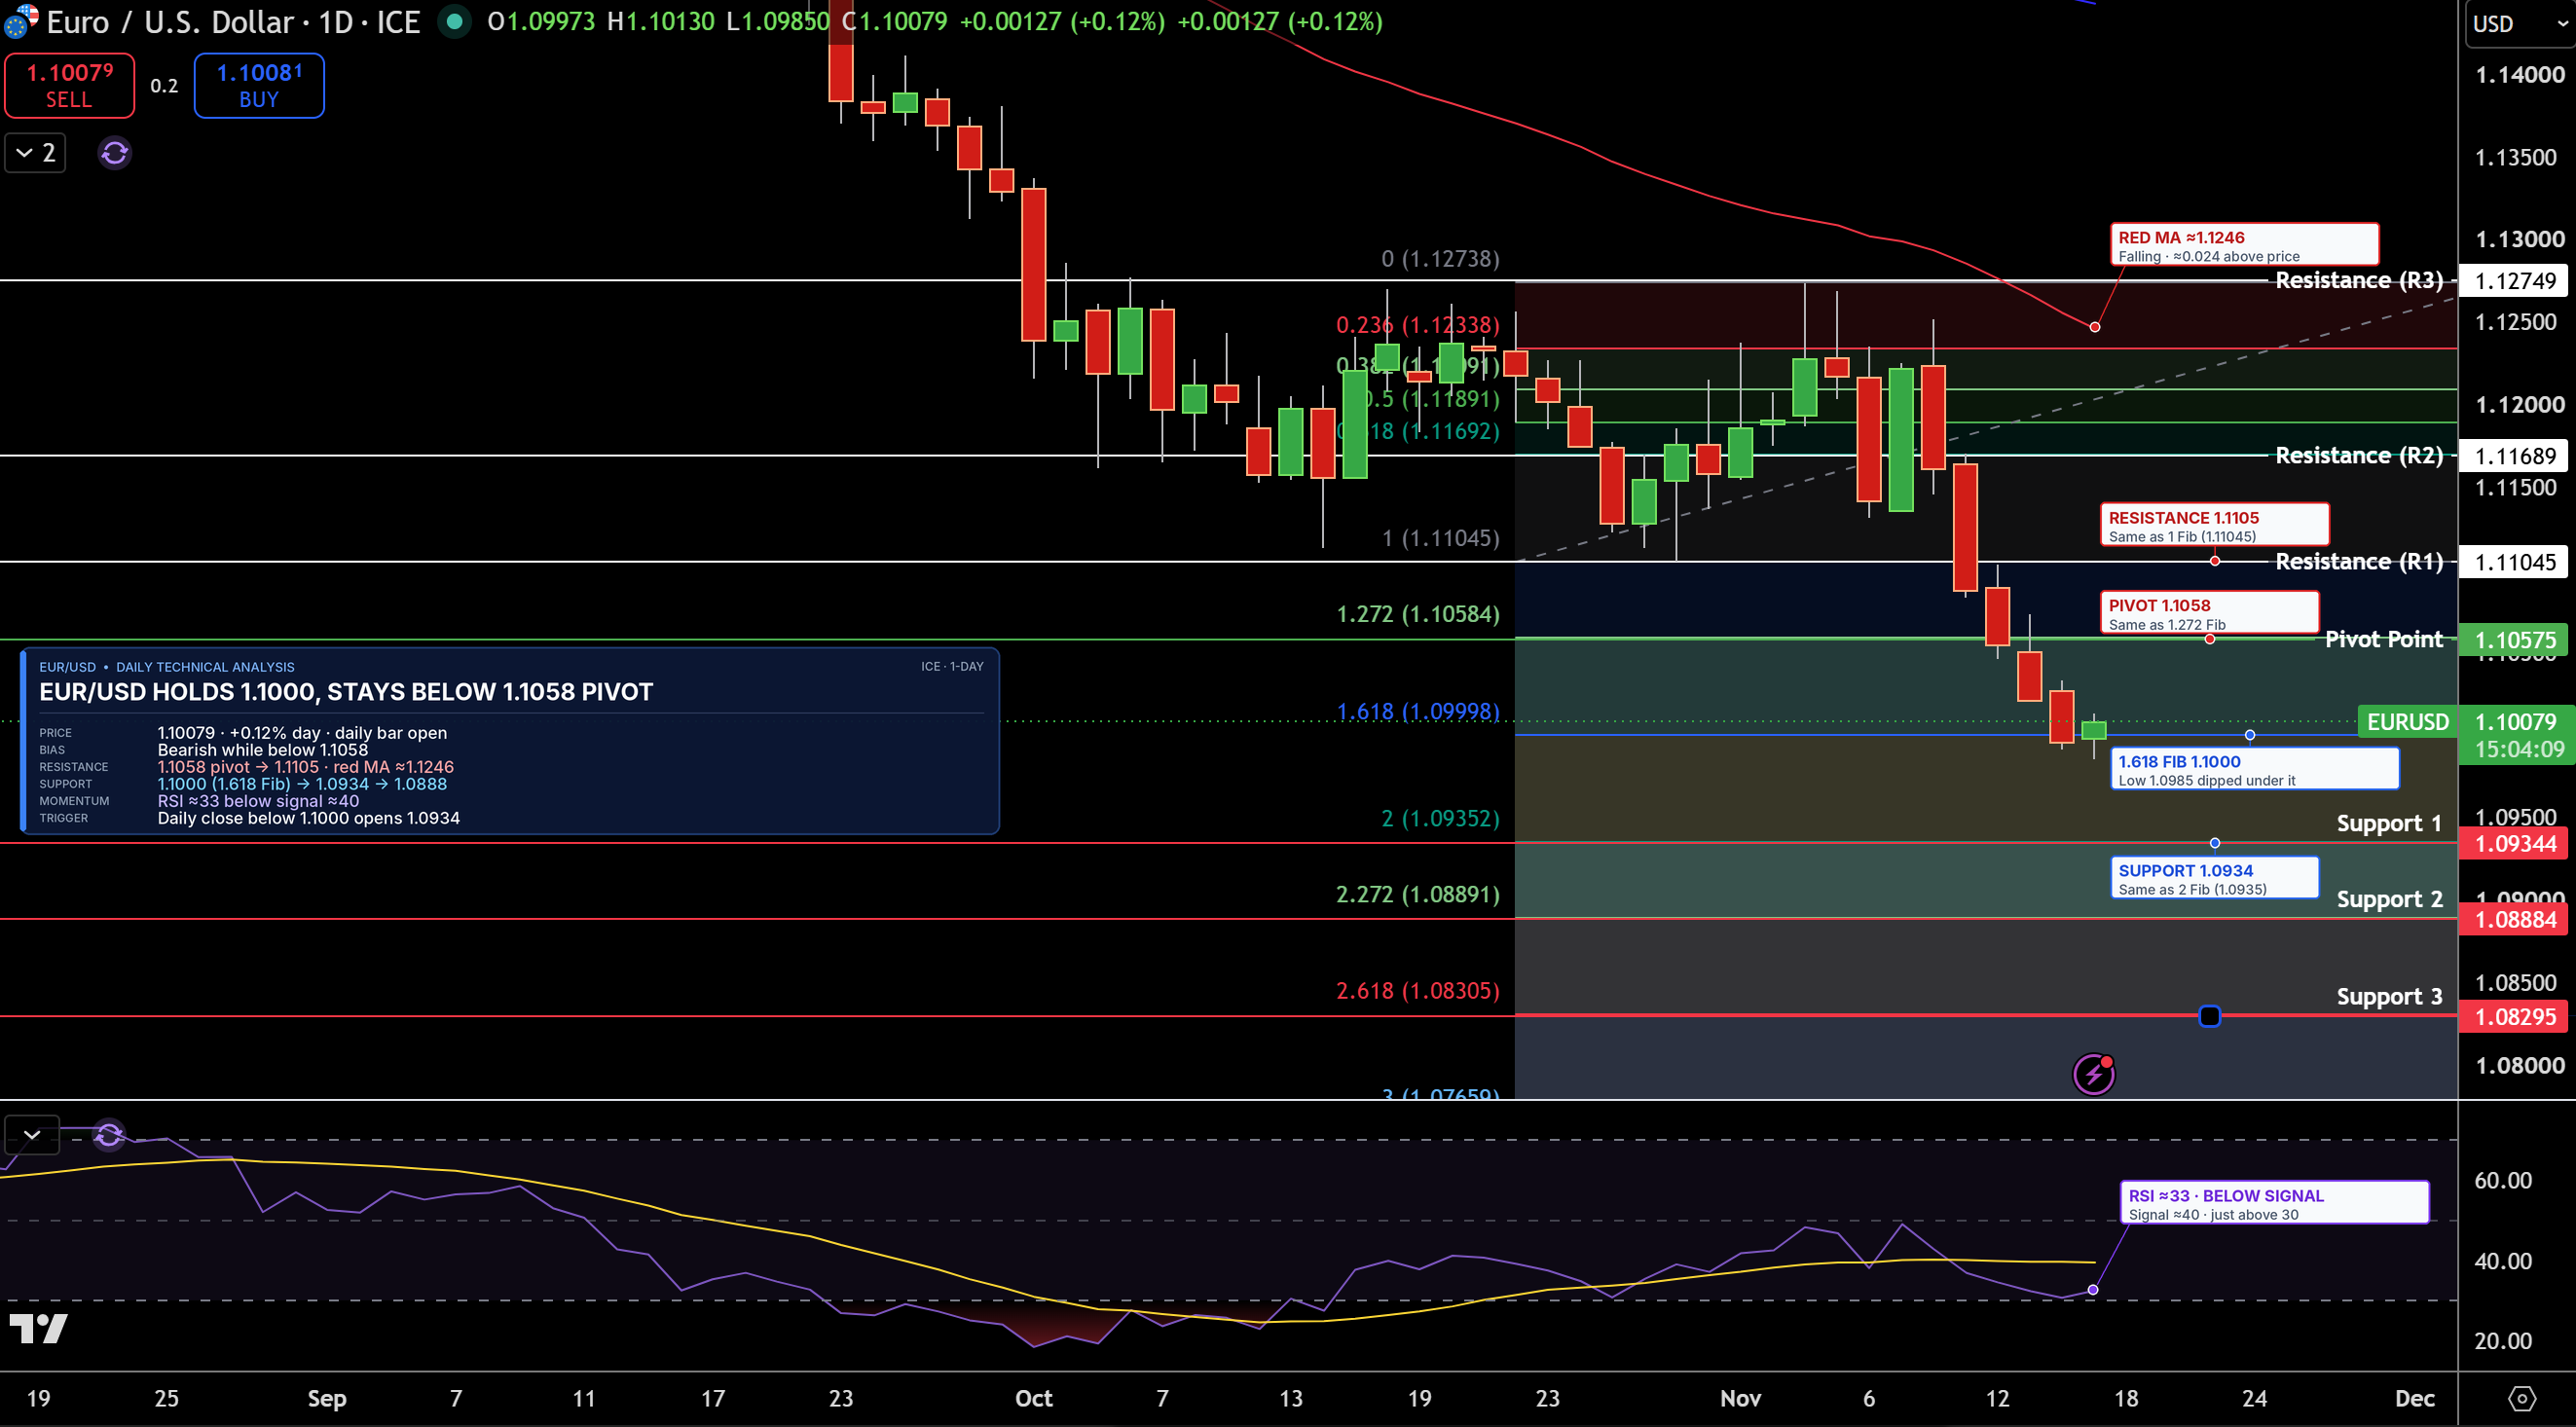
EUR/USD is trading near 1.1008 on the daily chart. Buyers stepped in near 1.1000, a Fibonacci extension level, which projects how far a move may stretch. The pair remains below its 1.1058 pivot and under a falling moving average.
Support is 1.1000, then 1.0934. Resistance is 1.1058, then 1.1105. RSI is near 33 and below its signal line. The bias stays bearish while EUR/USD holds below 1.1058, and a daily close below 1.1000 would open 1.0934.
GBP/USD Technical Analysis: Pound Bounces From 1.3174 Pivot as 1.3252 Comes Into Focus
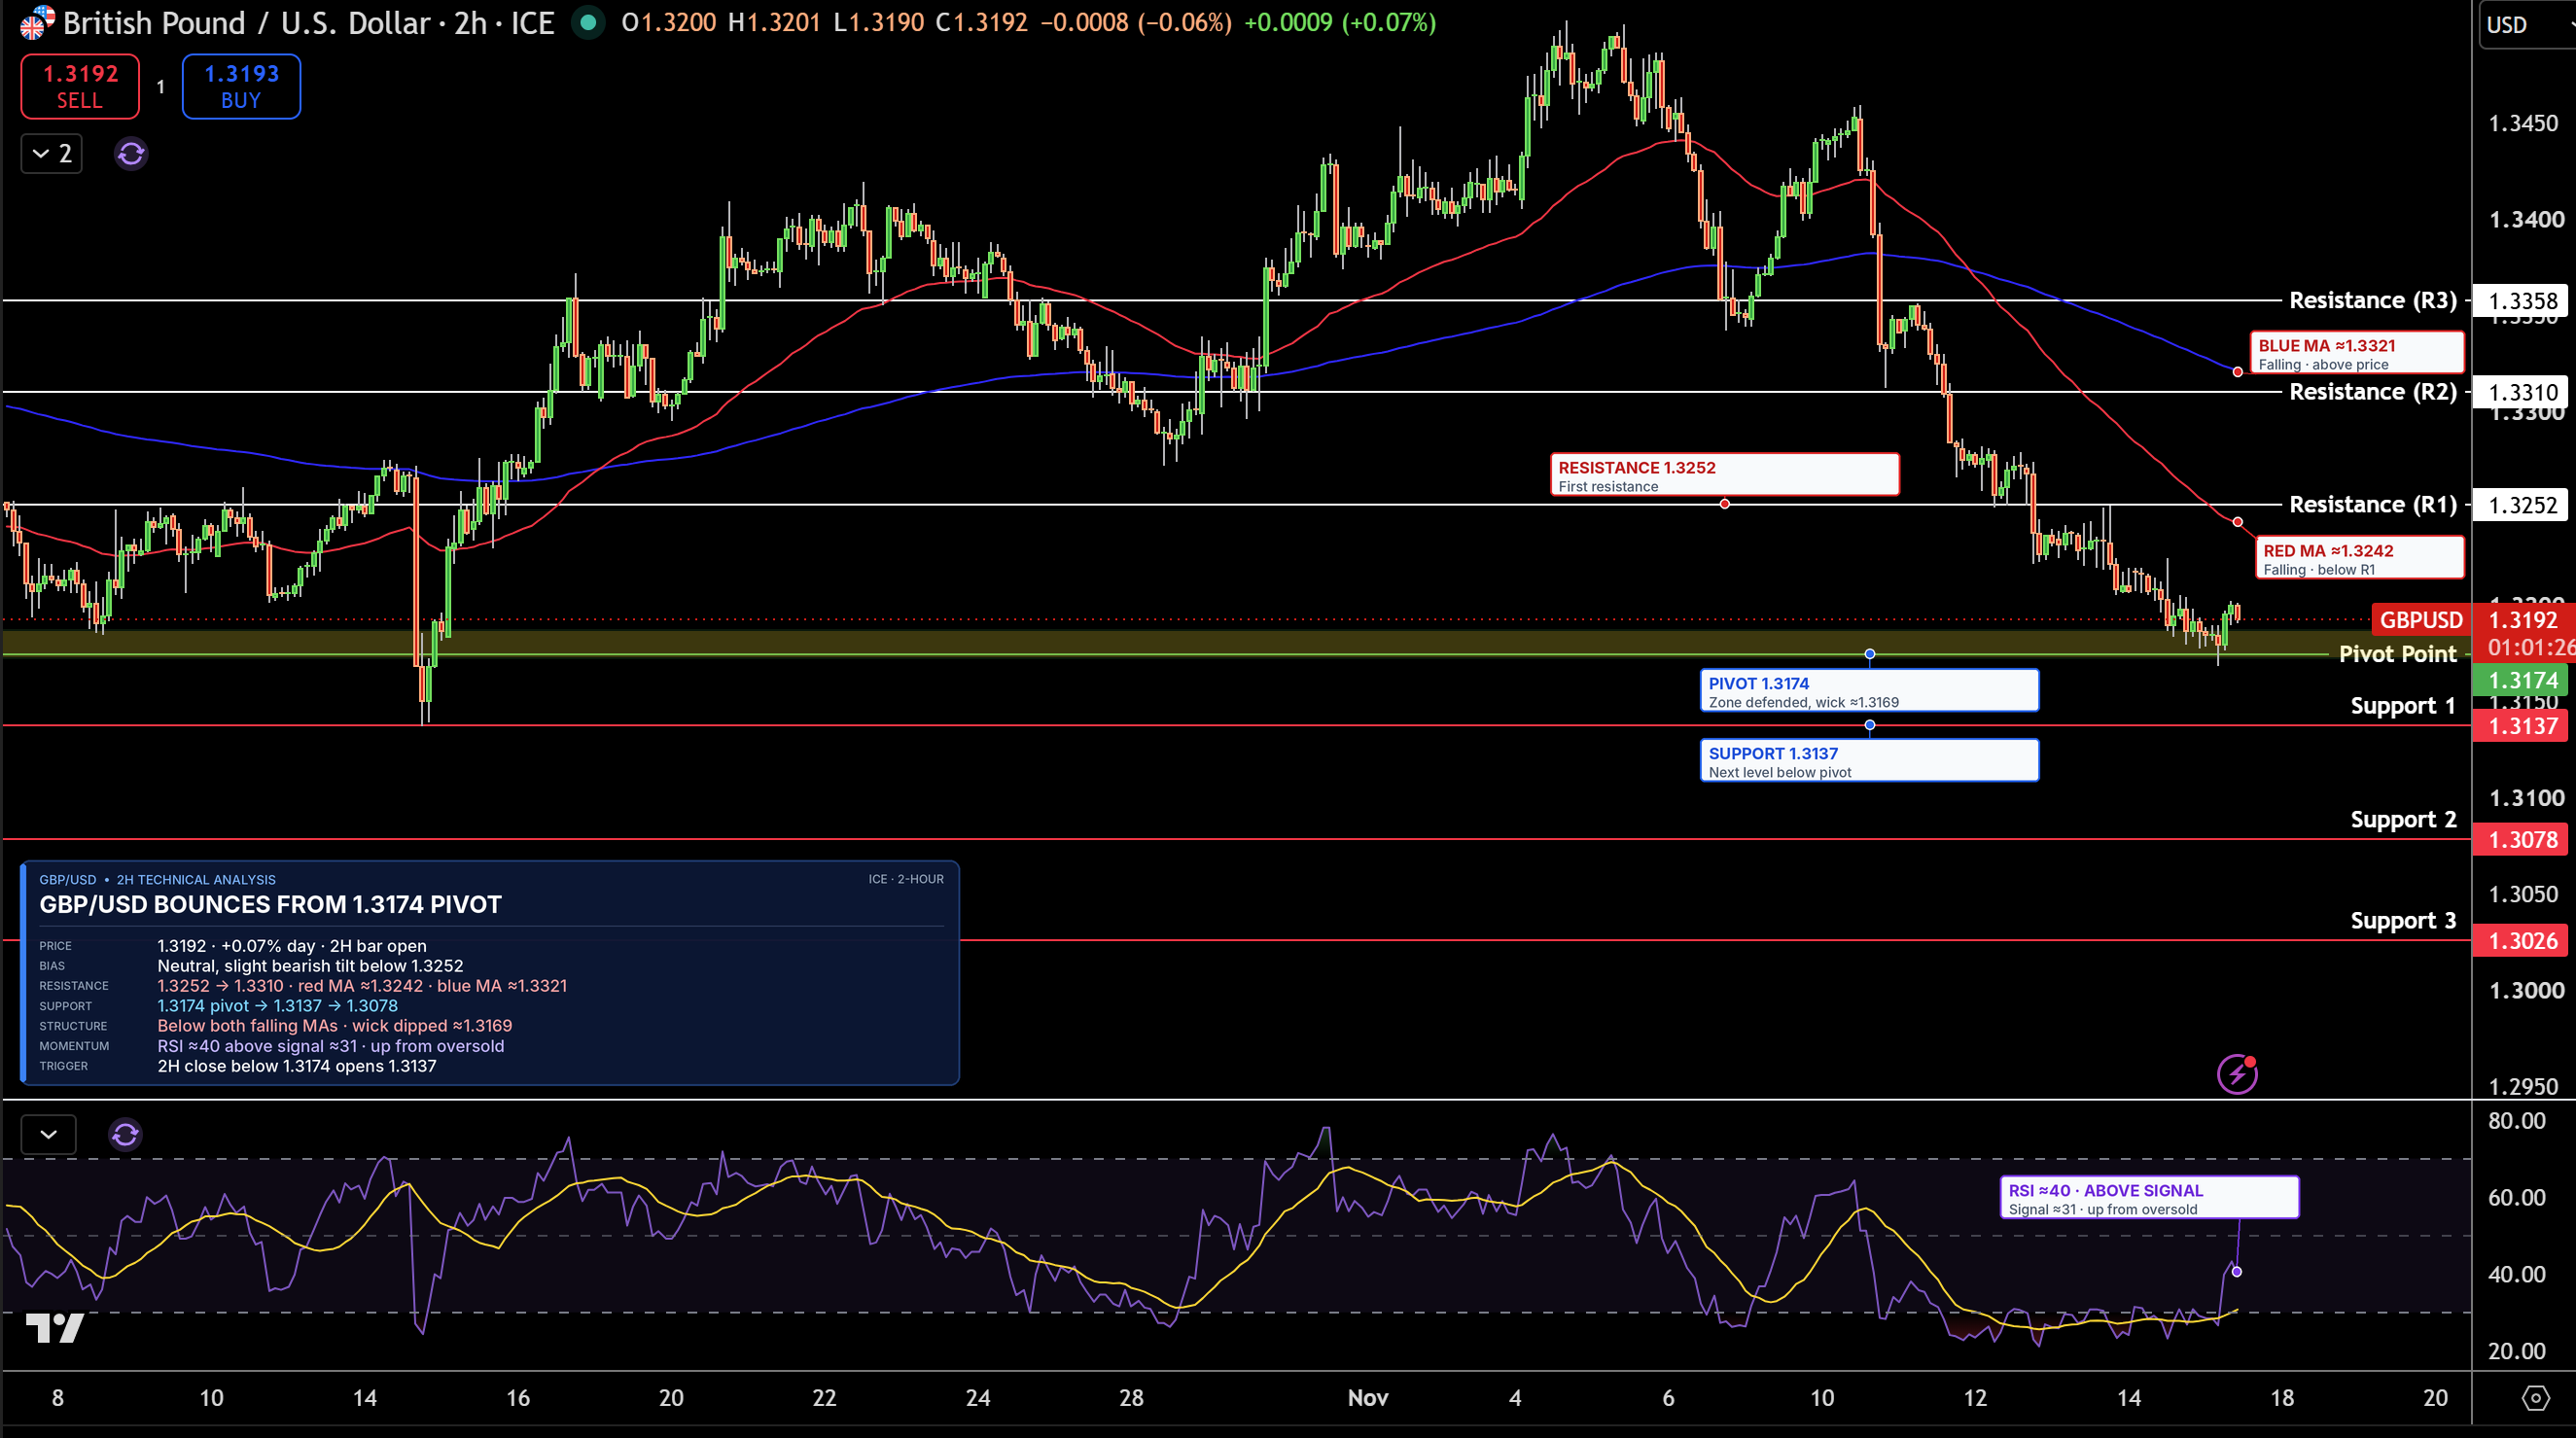
GBP/USD is trading near 1.3192 on the 2-hour chart after buyers defended the 1.3174 pivot zone, where a wick dipped to about 1.3169. The pound is still below both moving averages, which are falling.
Resistance is 1.3252, then 1.3310. Support is 1.3174, then 1.3137. RSI has climbed to about 40 from oversold and moved above its signal line. The pound keeps a slight bearish lean while it stays below 1.3252, and a close below 1.3174 would open 1.3137.