


A sharp rise in U.S. Treasury yields helped drive the U.S. Dollar higher versus the Canadian Dollar last week. The benchmark 10-year U.S. Treasury yield broke through the psychological 3 percent level, making the Greenback a more attractive asset. The Forex pair could continue to climb this week if the spread between U.S. Government Bond yields and Canadian Government Bond yields continues to widen.
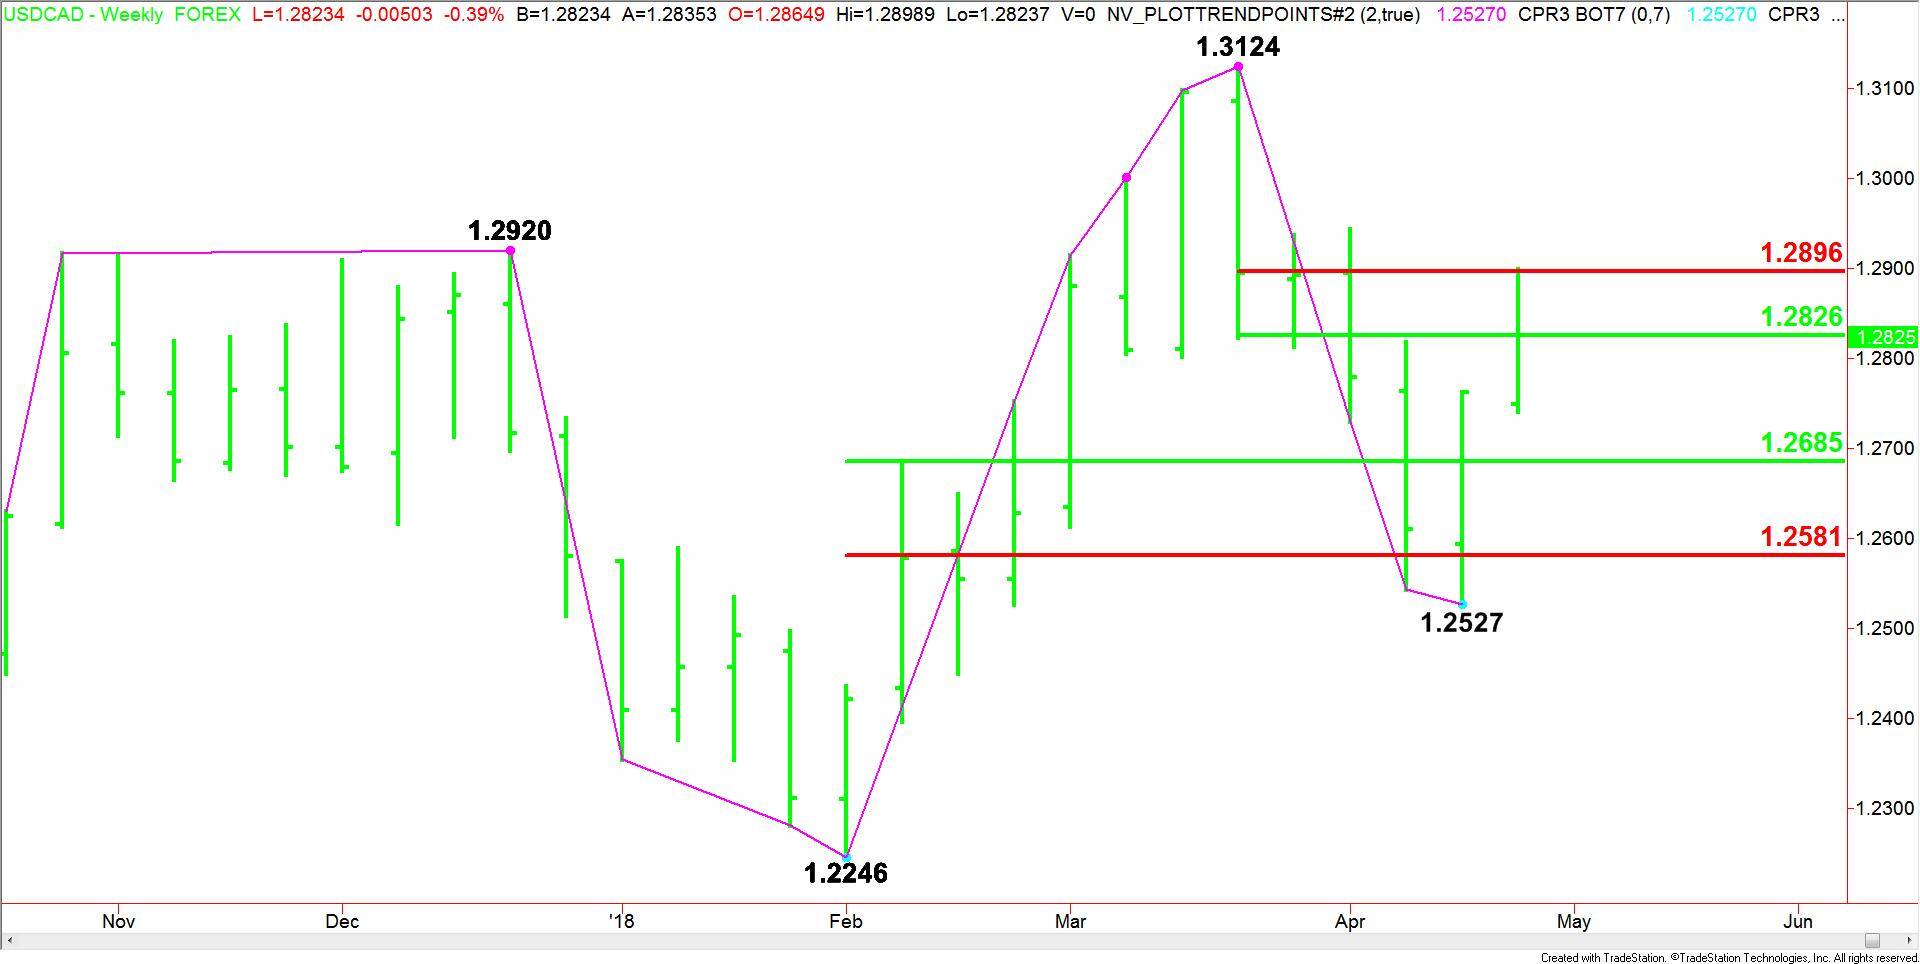
The USD/CAD settled the week at 1.2825, up 0.0064 or +0.50%.
Weekly Swing Chart Technical Analysis
The main trend is up according to the daily swing chart, however, momentum is still a problem.
Rising crude oil price helped trigger a closing price reversal top the week-ending March 23. This move was confirmed and the Forex pair continued to break for another 4 weeks.
The closing price reversal bottom the week-ending April 20 is trying to shift momentum back to the upside, but interest rates are going to have to continue to climb to support this move.
The main range is 1.2246 to 1.3124. Its retracement zone at 1.2685 to 1.2581 is new support. Momentum will shift back to the downside if this zone fails.
The short-term range is 1.3124 to 1.2527. Its retracement zone at 1.2826 to 1.2896 is the primary upside target and resistance. Overtaking this area will confirm the shift in momentum back to the upside.
Weekly Swing Chart Technical Forecast
Based on last week’s close at 1.2825 and the price action, the direction of the USD/CAD is likely to be determined this week by trader reaction to the short-term 50% level at 1.2826.
A sustained move under 1.2826 will indicate the presence of sellers. If this move generates enough downside momentum, we could see a drive into main 50% level at 1.2685. We could see a technical bounce on the first test of this level, however, look for a possible acceleration into the main Fibonacci level at 1.2581 if the 50% level fails.
A sustained move over 1.2826 will signal the presence of buyers. This could generate enough upside momentum to challenge the short-term Fib at 1.2896. Look for selling on the first test of this level and a possible acceleration to the upside if this level is taken out with strong buying.