



The Dollar/Yen finished higher for a fifth consecutive week. The move started with the formation of a closing price reversal bottom the week-ending March 30. The strong close has put the Forex pair in a position to test the first objective of the chart pattern. This could cause some turbulence for buyers.
Last week, the USD/JPY settled at 109.045, up 1.422 or +1.32%.
Weekly Swing Chart Technical Analysis
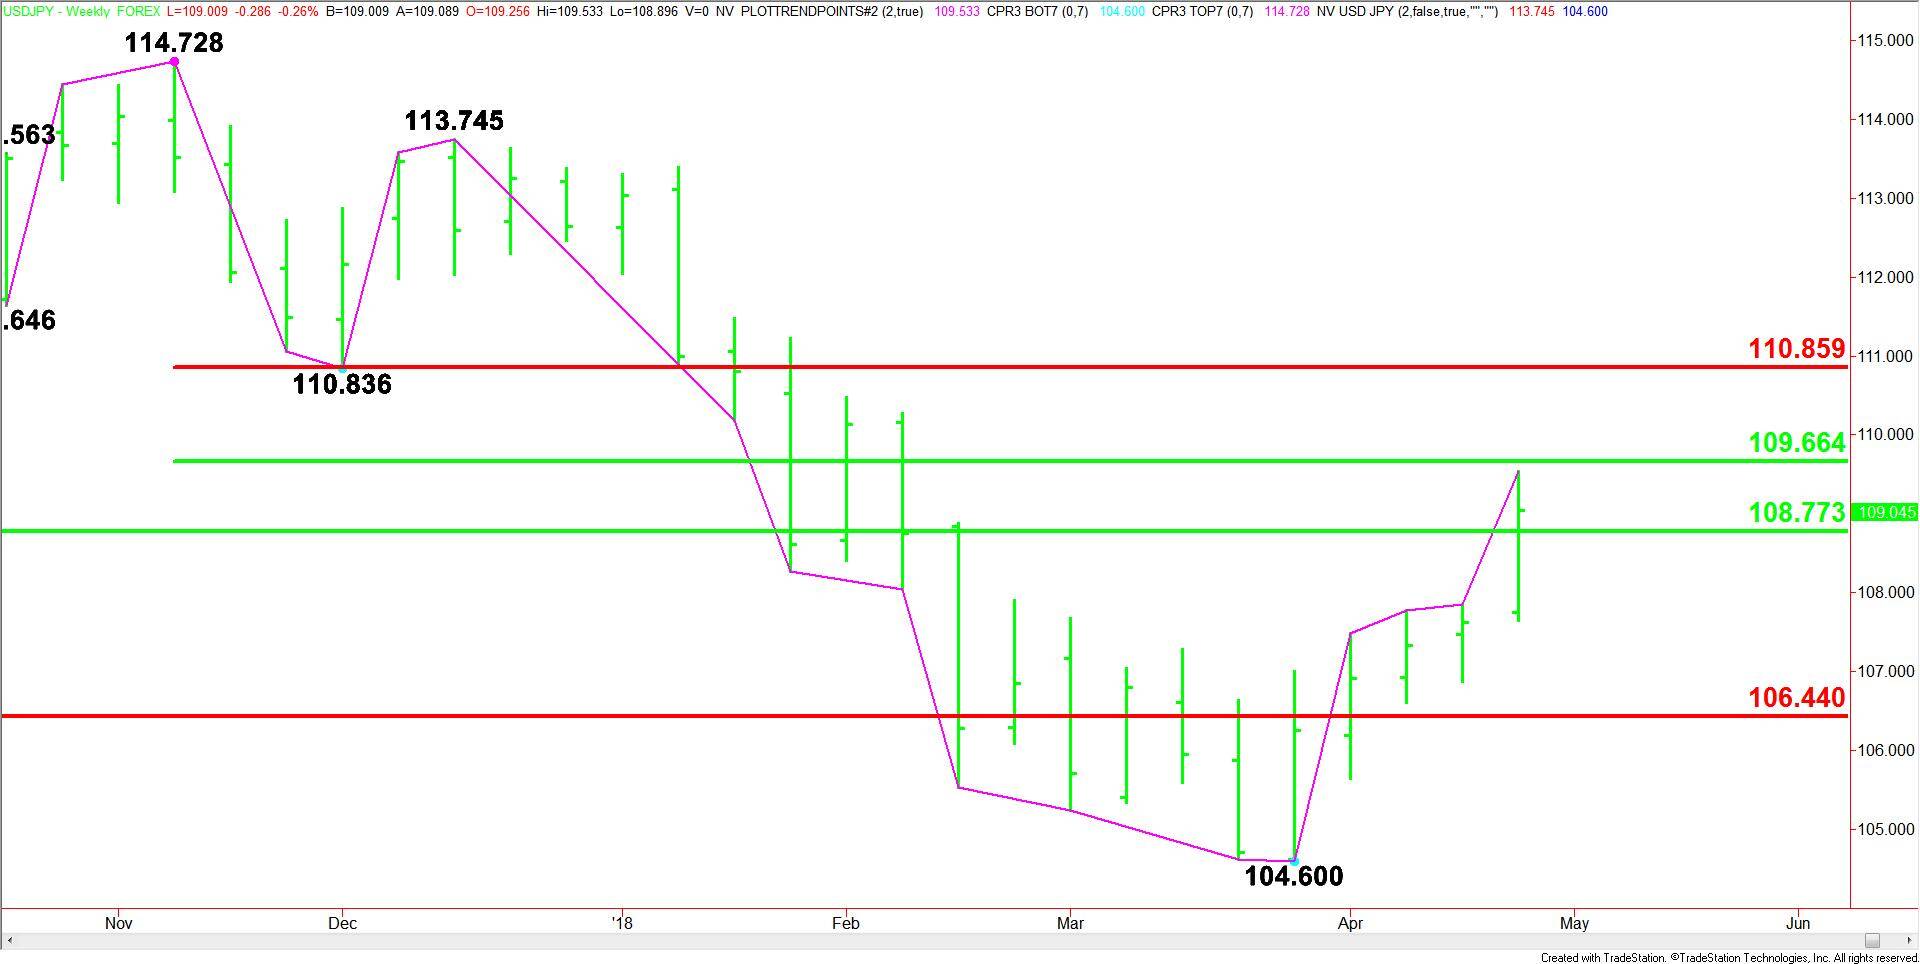
The main trend is down according to the weekly swing chart. The combination of the closing price reversal bottom and the subsequent follow-through rally is generating strong upside momentum. However, as you can see on the weekly chart, no main tops have been crossed during this rally. Therefore, the main trend is still down.
The major long-term range was formed by the June 2016 top at 98.887 and the December 2016 bottom at 118.658. Its 50% to 61.8% retracement zone is 108.773 to 106.440. The USD/JPY consolidated at or near this zone from the week-ending January 26 to the week-ending April 20. Last week’s close was above this zone. This also signals an upside bias.
The main range is 114.728 to 104.600. Its retracement zone at 109.664 to 110.859 is the primary upside target. Since the main trend is down, sellers may show up on a test of this zone.
Weekly Swing Chart Technical Forecast
Based on last week’s close at 109.045, the direction of the USD/JPY this week is likely to be determined by trader reaction to the major 50% level at 108.773.
A sustained move over 108.773 will indicate the presence of buyers. This could drive the Forex pair into the main 50% level at 109.664. Since the main trend is down, we could see sellers show up on a test of this level.
Overcoming 109.664 will indicate the buying is getting stronger. This could trigger a surge into the main Fibonacci level at 110.859. Once again, sellers could show up on a test of this level. This is also the trigger point for an acceleration to the upside with 113.745 the next major upside target.
A sustained move under 108.773 will signal the presence of sellers. If this move generates enough downside momentum, we could see a retracement of the four week rally. This could fuel a short-term pullback to at least 107.00 over the near-term.