The USD/JPY pair fell initially on Wednesday but found enough support again near the 112.50 level to turn things around and form a hammer. The hammer of
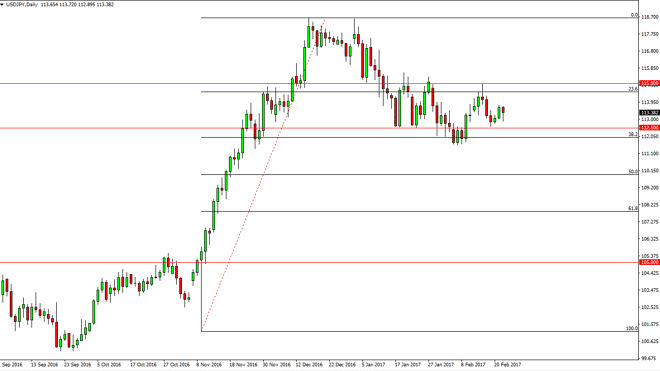
The USD/JPY pair fell initially on Wednesday but found enough support again near the 112.50 level to turn things around and form a hammer. The hammer of course is a bullish sign and if we can break above the top of a, I don’t see any reason we can’t continue to go towards the 115 level above. A break above that level could be extraordinarily bullish and send this market reaching towards the 118.50 level. Ultimately, the markets continue to see quite a bit of volatility, but given enough time I think the buyers will take control again.
Chris is a proprietary trader with more than 20 years of experience across various markets, including currencies, indices and commodities. As a senior analyst at FXEmpire since the website’s early days, he offers readers advanced market perspectives to navigate today’s financial landscape with confidence.