


Earnings Rally Reclaims Key Technical Levels
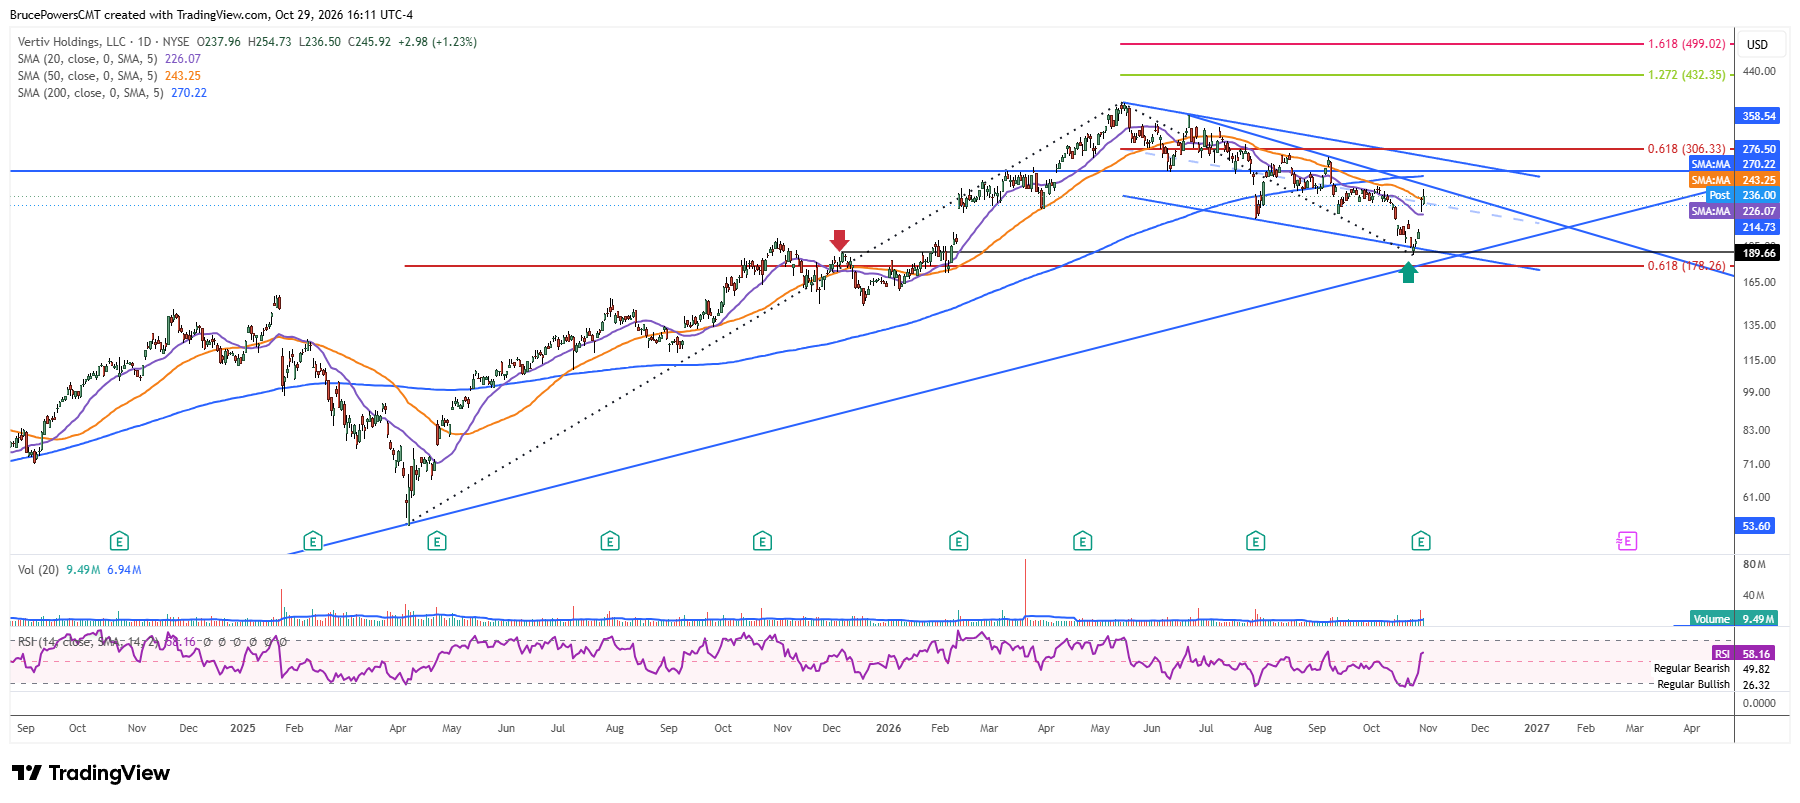
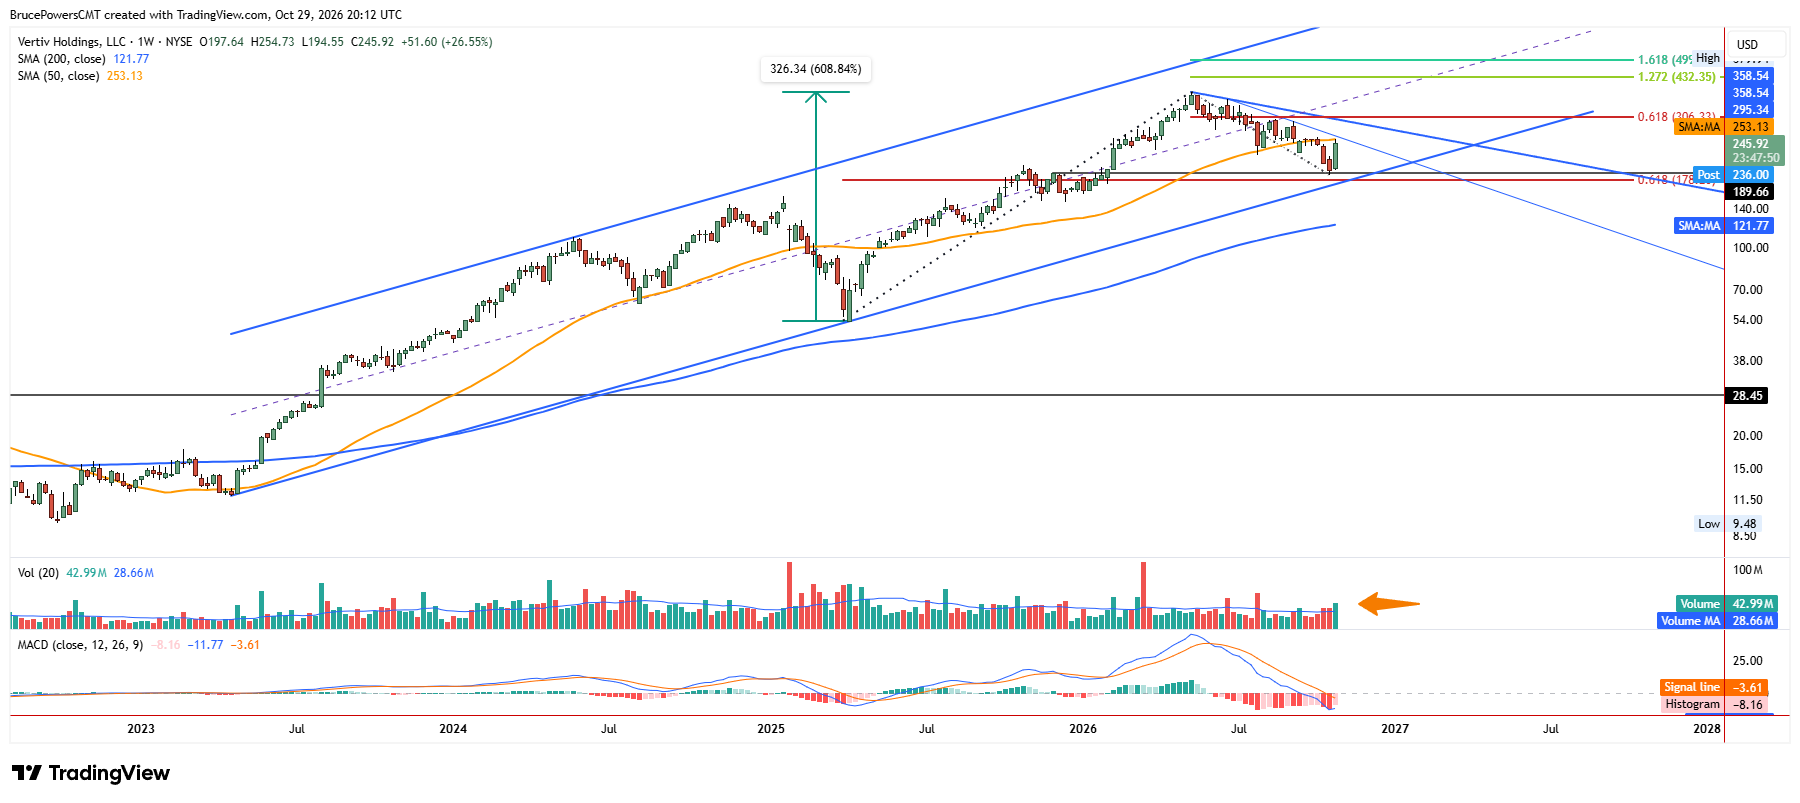
Vertiv Holdings, LLC (VRT), provides critical digital infrastructure for data centers, communication networks, and commercial/industrial environments. The company reported Q3 2026 earnings on October 28, 2026, and the market responded with a gap up opening and bullish extension on Thursday to a high of $264.73. The two-day advance showed strength, with the stock reclaiming the 20-day moving average, the midline of a falling channel, and the 50-day moving average. In addition, a potential bullish reversal signal emerged on the weekly chart.
VRT Tests Resistance After Potential Correction Low
This bullish price action follows the possible completion of the recent bearish correction, which reached last week’s new low of $187.24. VRT is getting extended and heading toward key resistance, defined by the confluence of several indicators in the $258.10 to $271 range. The first level is a lower swing high and the second the 200-day moving average.
However, the recent low formed near support at a prior interim high and the lower boundary of a falling trend channel, while also remaining not far from the long-term rising trendline. This confluence of support levels raises the possibility that the correction has ended, and the long-term uptrend can resume.
A Reclaim of $270 Could Revive Longer-Term Upside
Given the potential for a continuation of the long-term trend VRT can be watched for new opportunities and a potential upside breakout above the downtrend line and then the 200-day moving average near $270. A sustained reclaim of that average would improve the bullish technical position for the stock and increase the possibility of eventually challenging or exceeding the peak of $379.94 from May.
Fibonacci Targets Point Toward $432 and $499
If VRT can successfully reclaim the 200-day moving average, a lower swing high of $300.30 from August becomes the next upside target, followed by the 61.8% Fibonacci retracement of the prior decline at $306.33. If the trend then continues to extend to new highs, the 127.2% Fibonacci extension of the recent decline near $432 and the 161.8% Fibonacci extension at $499 would represent higher targets. Reaching the 61.8% retracement would also coincide with a bullish reversal signal triggered by a break above the lower swing high of, adding to the signs of strengthening bullish momentum.
If you’d like to know more about technical analysis and how traders use it, please visit our educational area.