


Earnings Rally Follows Major Corrective Decline
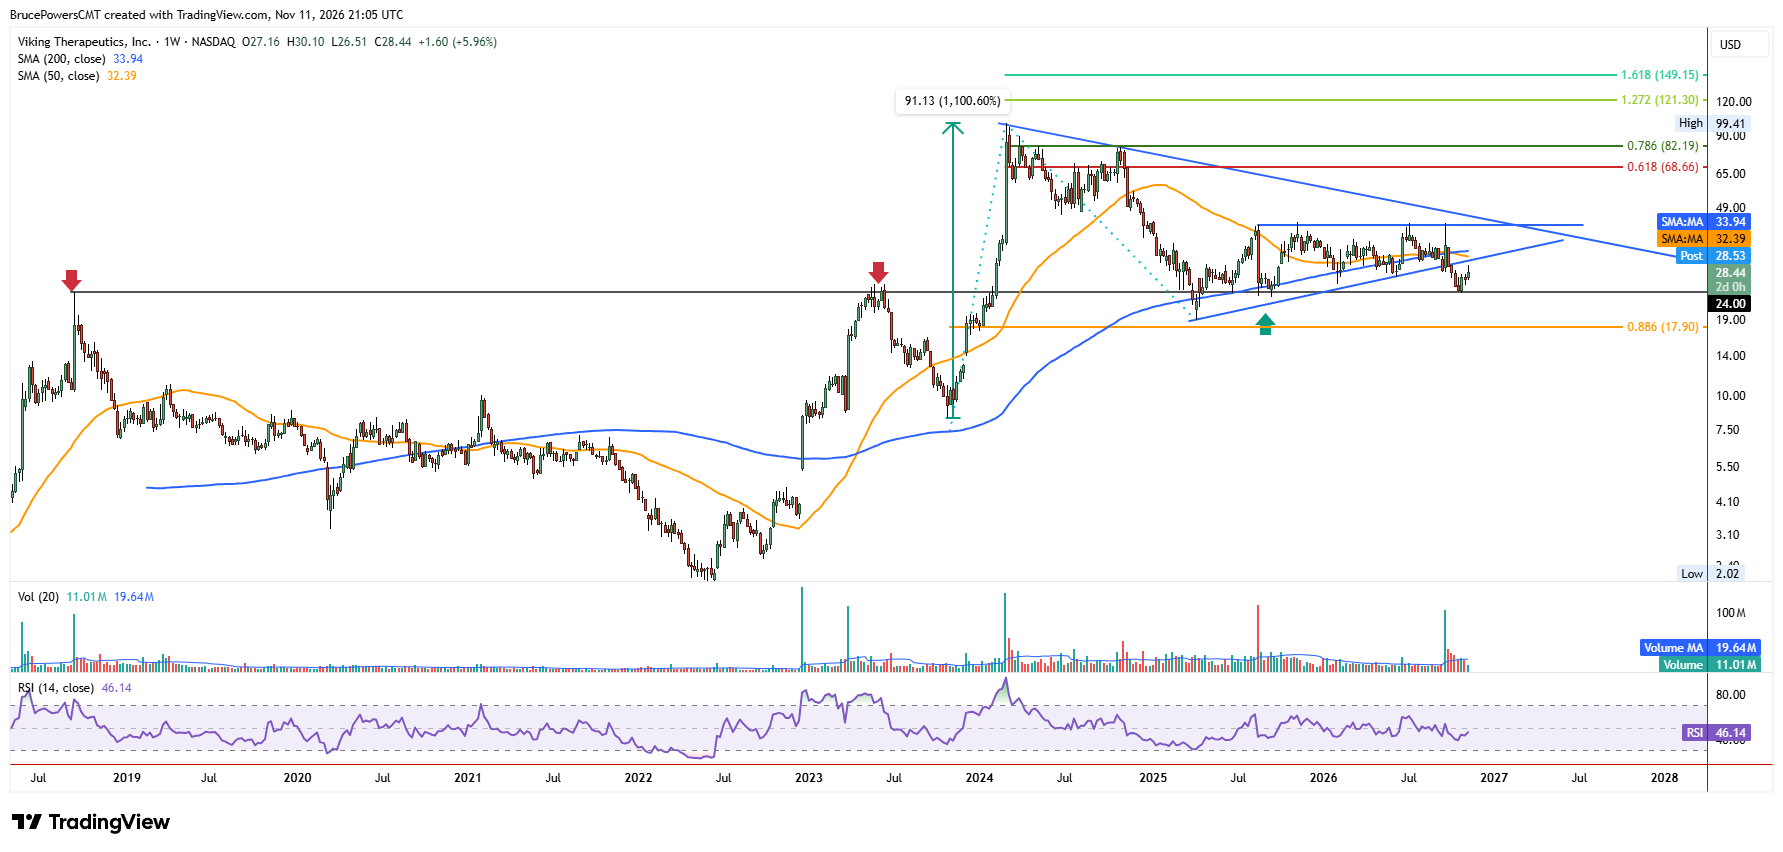
Viking Therapeutics, Inc. (VKTX) is a clinical-stage biopharmaceutical company, placing it in a relatively strong industry group. The company reported Q3 2026 earnings on October 28 after the market close, with the stock subsequently rallying from the recent corrective low of $23.82. Looking back, VKTX completed an 88.6% Fibonacci retracement of the prior decline before reaching a corrective low of $18.92 in April 2025.
That decline took the stock below the 200-week moving average, but the average was quickly reclaimed after one week as buyers regained control, leading to a rally to $42.23 in August 2025. A consolidation range followed until a break below a rising trendline that marked the lower boundary of the pattern triggered a breakdown on October 5. That decline led to a low of $23.82 two weeks ago.
Historical Momentum Supports Bullish Potential
The bearish correction in VKTX began following a peak of $99.41 reached in February 2024. That high ended a sharp 1,100% rally from the October 2023 swing low of $8.28. This history could be significant as it speaks to the potential for strong bullish momentum in the stock. Although the current advance is facing potential resistance from the consolidation range, the recent low found support at a prior key resistance area defined by two previous highs at $25.72 and $24.00, respectively. Support was also found in that area after the initial decline from the 2024 peak, adding to its significance.
Inverse Head-and-Shoulders Triggers Initial Reversal
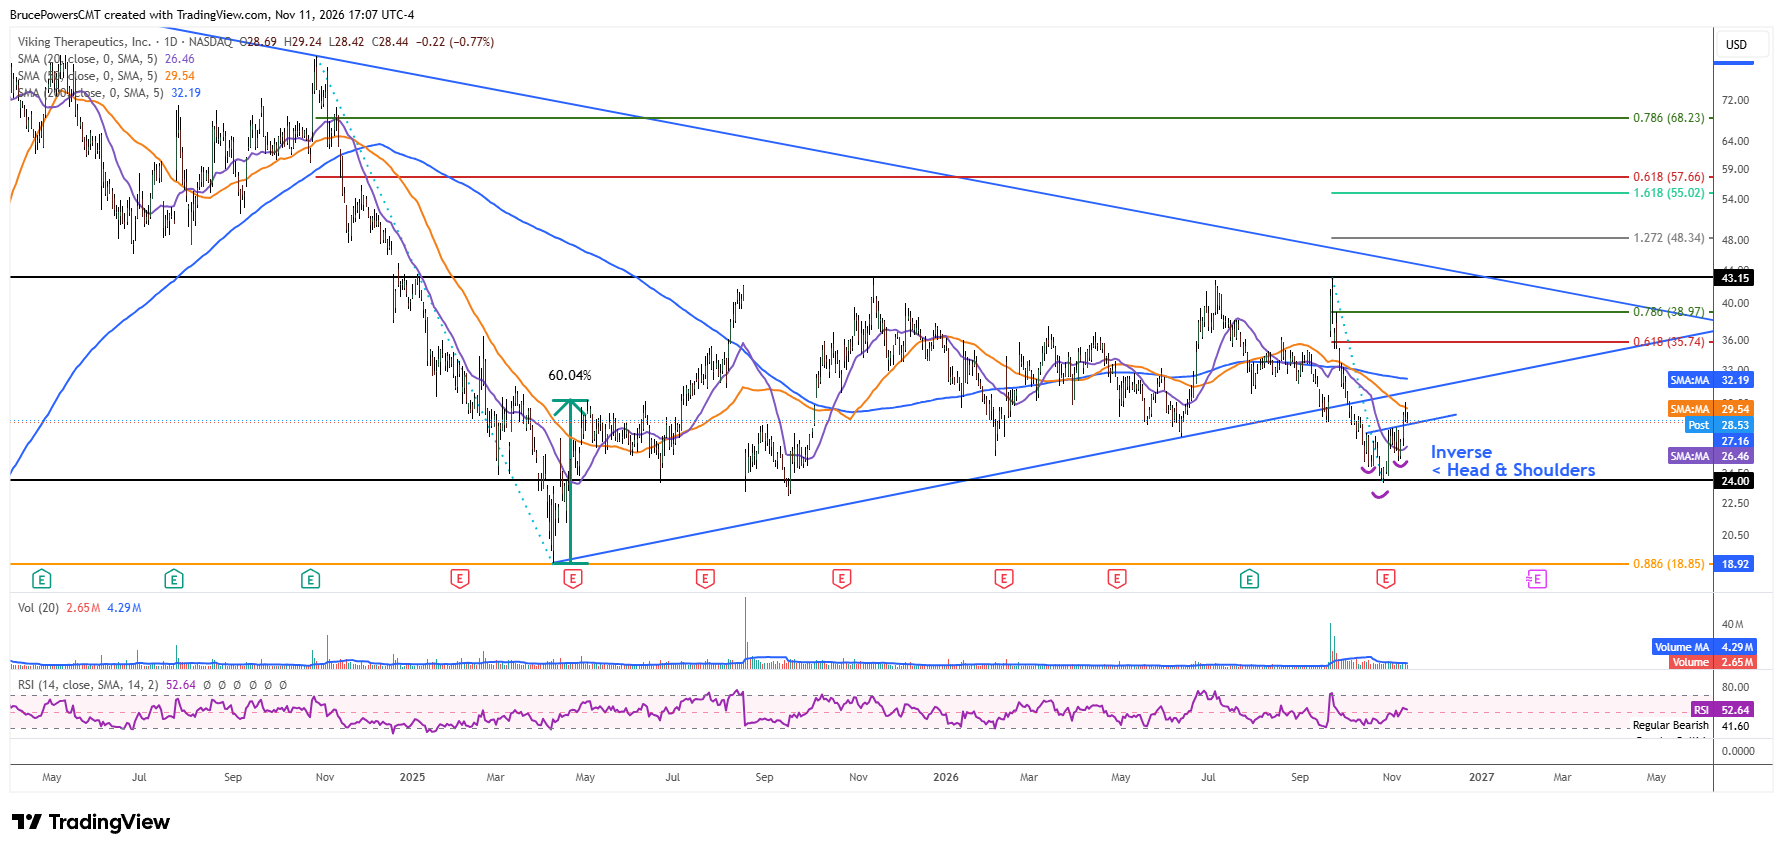
On the daily chart, a bullish reversal triggered on Monday with a move above $28.00, completing triggering a small inverse head-and-shoulders pattern on a move above $28.00. It may be the launching pad for an attempt to rally through the consolidation range and eventually trigger an upside breakout above its upper boundary at $43.55. The next sign of strength will come on a rise above the prior weekly high of $30.18. However, that level is near potential resistance defined by the rising boundary of the consolidation.
Moving Average Reclaims Set Up Stronger Confirmation
A more convincing sign of strength would come on a rally above the weekly high of $35.19, since that would follow a reclaim of the 50-week and 200-week moving averages, currently near $32.40 and $33.94, respectively. A successful breakout above the consolidation range would then provide stronger confirmation that the longer-term correction has run its course and that the stock’s earlier bullish momentum may be returning.
If you’d like to know more about technical analysis and how traders use it, please visit our educational area.