


Relative Strength in Weak Market
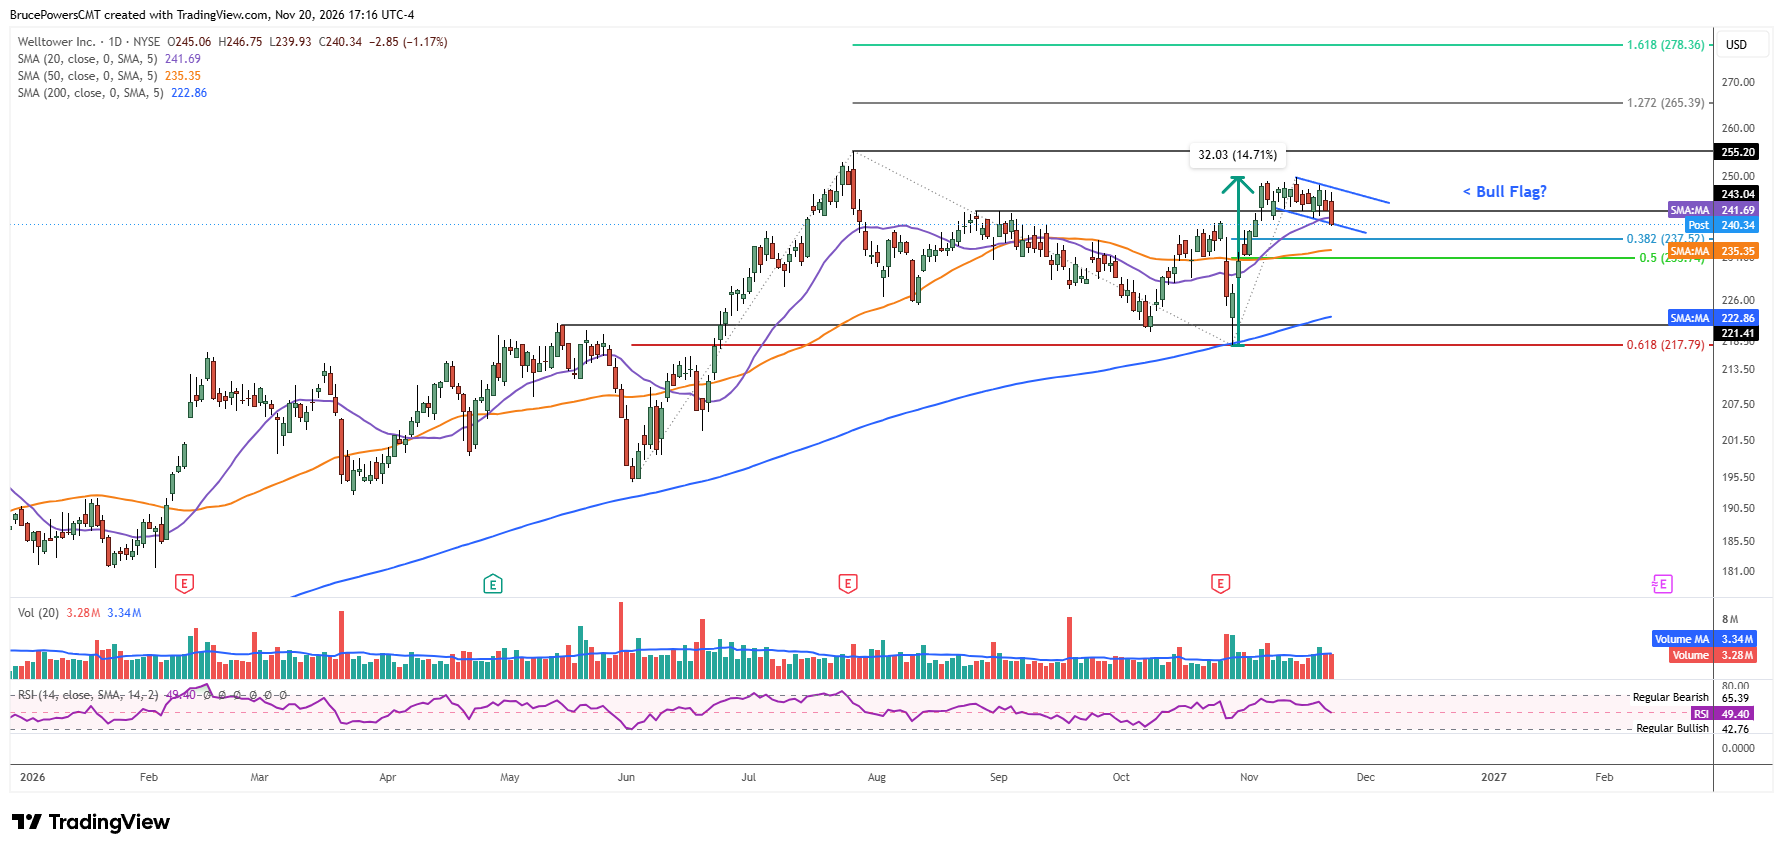
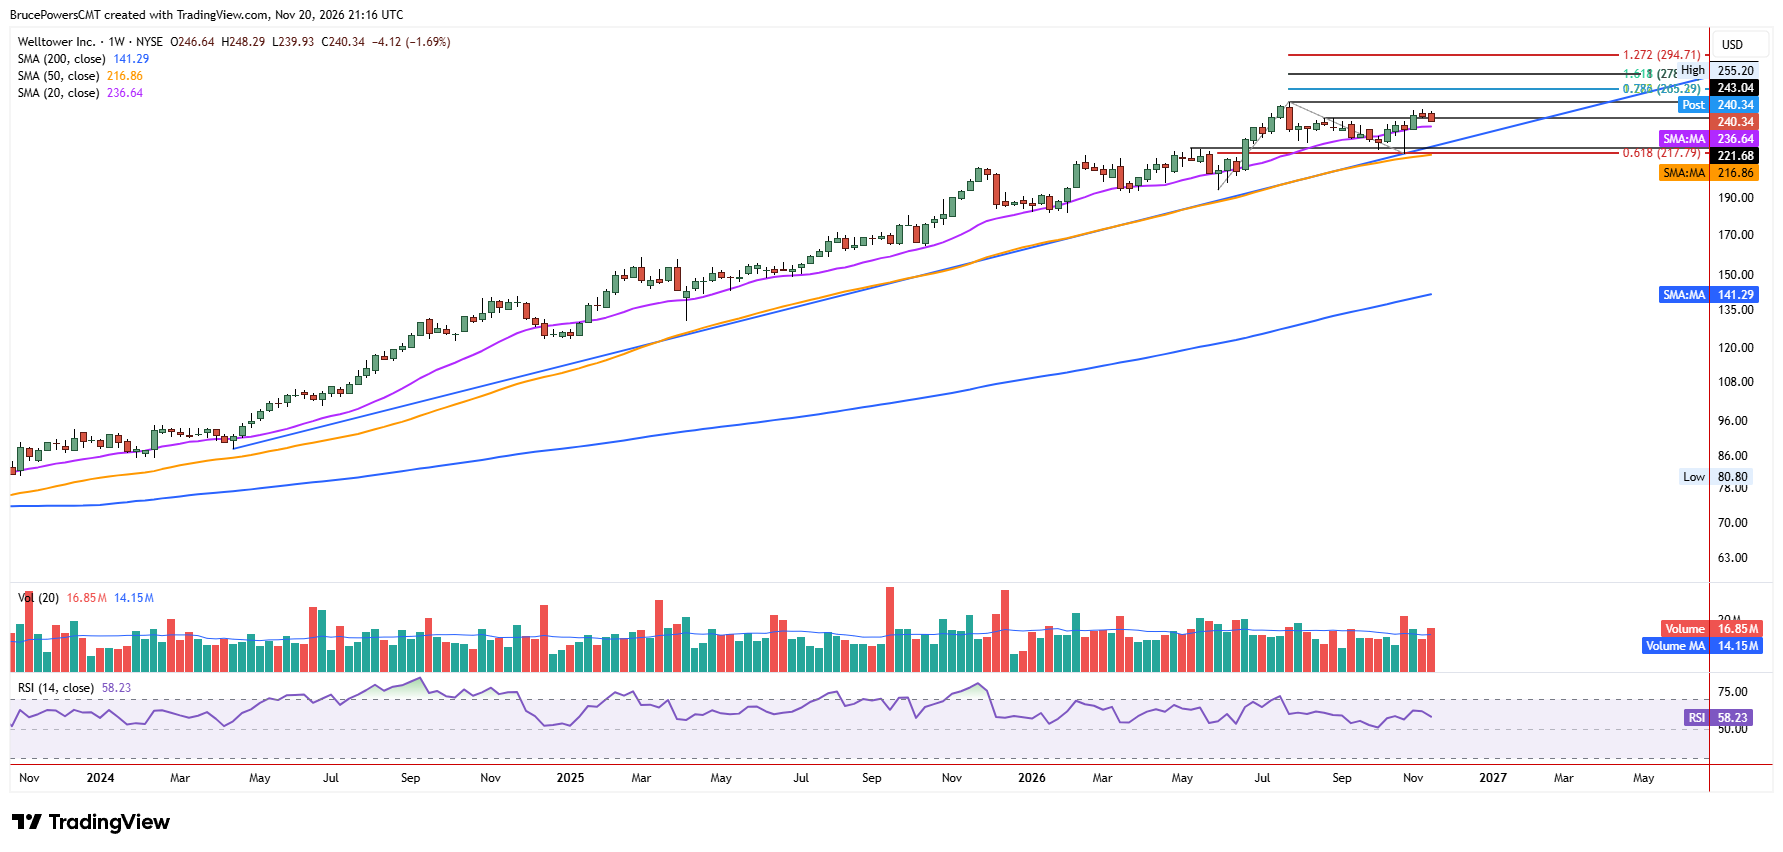
Despite broader market weakness, Welltower, Inc. (WELL), an S&P 500 healthcare facilities REIT, has demonstrated clear relative strength. Although healthcare sector performance has been down the past month, WELL has outperformed most other sectors. WELL reported Q3 2026 earnings after the market close on October 27, reaching a new low of $217.72 during the larger bearish correction that followed a peak of $255.20 in July. That low completed a 61.8% Fibonacci retracement of the prior advance and tested support at the 200-day moving average.
Undercut-and-Rally Breakout
Buyers stepped in from there and drove price higher, with a recovery of the prior low of $220 occurring in one day. That generated a bullish candlestick and an undercut-and-rally pattern. The result was a decisive rally through a larger resistance zone formed by consolidation during the bearish correction. An upside breakout above $243.04 triggered a bullish reversal signal indicating that the correction may be complete. Subsequently, a high of $249.75 was reached last week, leading to the first pullback after a significant breakout.
Pullback Below 20-Day Average
A new pullback low of $239.93 was hit on Friday, following a break below the 20-day moving average, which had been reclaimed on October 29. Since the 20-day moving average has failed as support, lower support levels could be tested before a bottom is established. Once support is found and followed by strength, a second leg up from the October bottom may be ready to proceed. Other potential support levels are at the 38.2% Fibonacci retracement at $237.52, the 50-day moving average near $235.38, and the 50% retracement of the prior advance at $233.74.
Bullish Flag Targets
The correction since last week’s high has formed a relatively tight consolidation pattern resembling a bullish flag. However, the pattern has not completed, and it could morph into a larger pattern. For now, a rise above $248.29 would be a sign of strength and an early breakout signal, while an advance above $249.75 would signal a continuation of the bullish trend. Initial upside targets following a breakout would be the recent peak of $255.20, followed by a 127.2% Fibonacci extension of the recent correction at $265.39 and a 161.8% extension at $278.36. Sustained strength through these levels would further confirm WELL’s relative strength in a weaker broader market.
If you’d like to know more about technical analysis and how traders use it, please visit our educational area.