


WTI Crude
WTI opens Thursday with a fresh decline in U.S. commercial crude inventories, although the final product picture is a bit mixed. The EIA’s October 28 release showed that crude stocks of 410.625 million barrels for the week ending October 23 were down 1.892 million barrels from the previous week. Gasoline inventories increased 3.87 million barrels to 209.18 million, while distillate stocks had fallen 1.462 million barrels to 102.824 million.
October Has Seen Declines
The decline in crude does extend the reduction visible across the month of October. Commercial stocks stood at 424.134 million barrels on October 2. They have subsequently fallen by 13.50 million barrels based on the published figures. The chart just below includes every weekly observation from September 18 through 23.
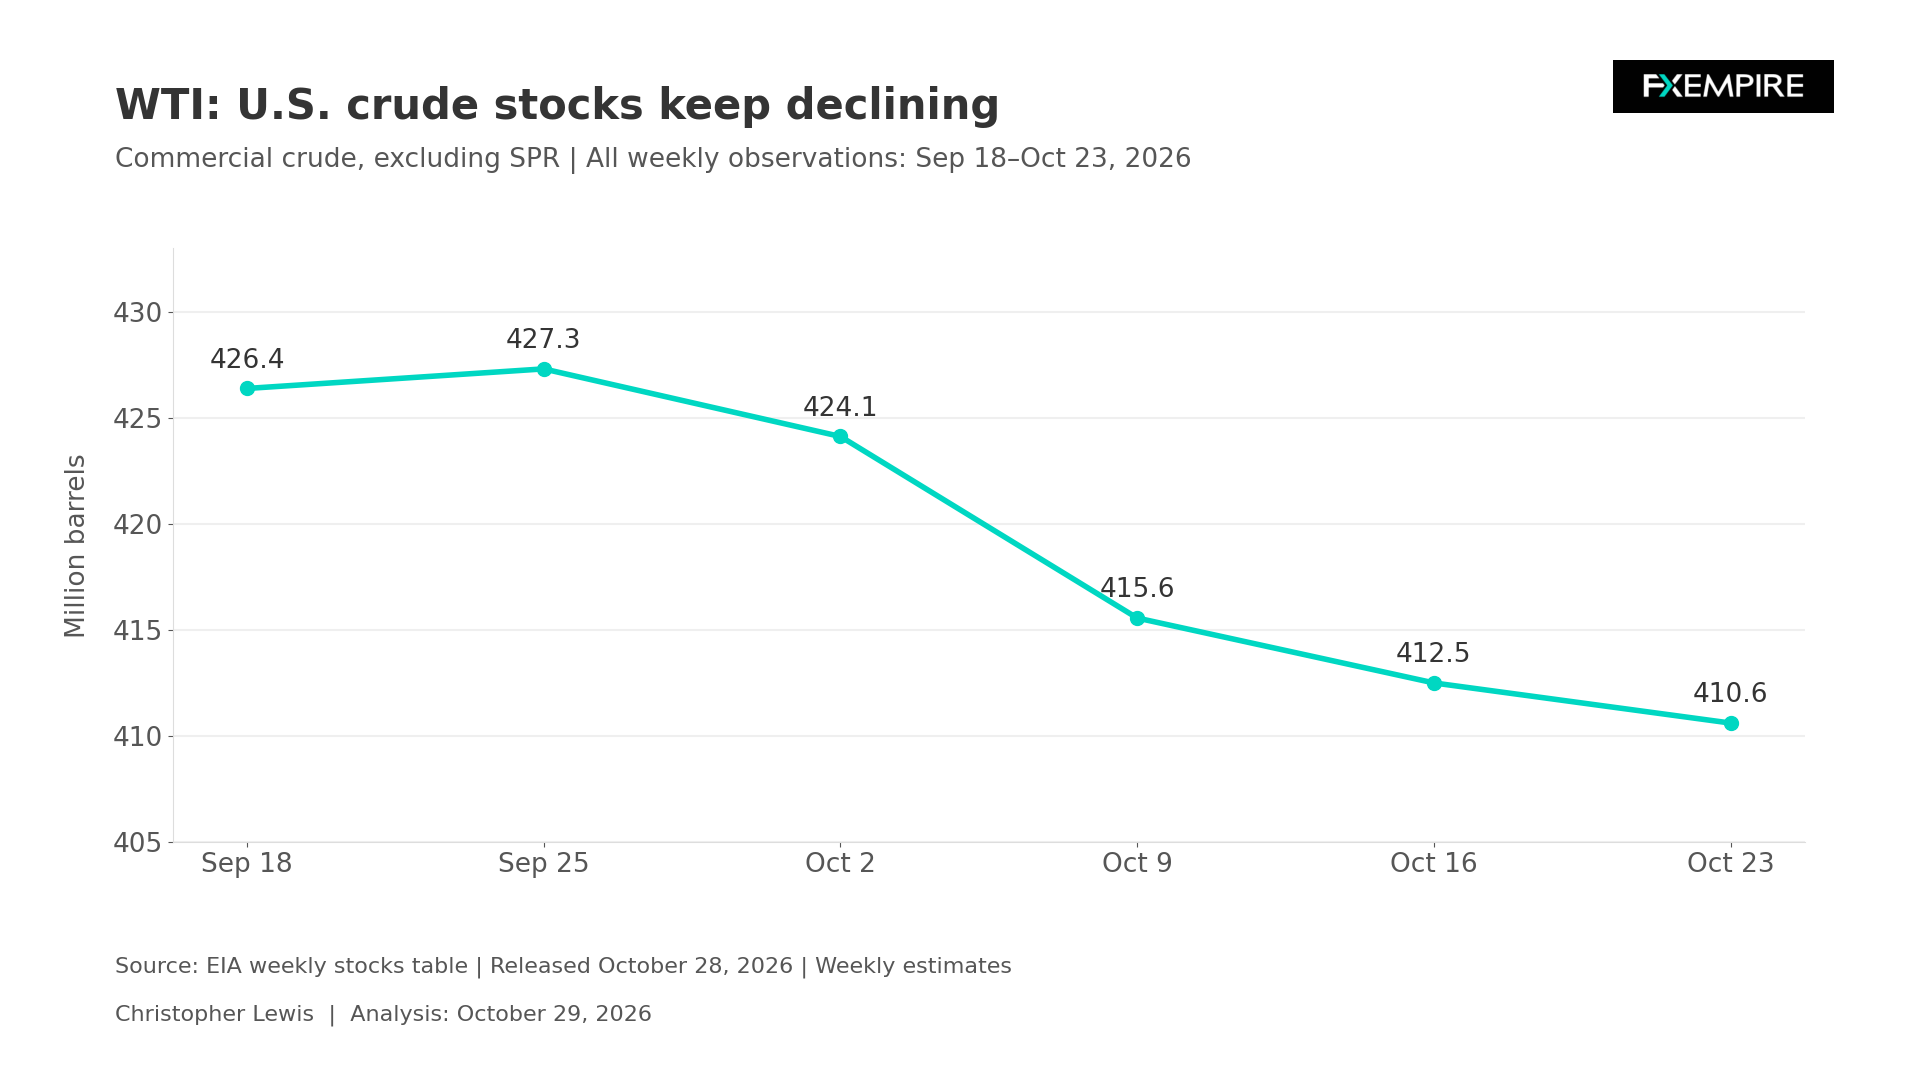
This suggests that the inventory trend supports the physical market argument for WTI but does not establish that consumption alone is responsible for the readings that we are seeing. Stocks reflect the combined effects of production, processing, imports, and exports. Therefore, a draw of stock could occur under several different demand conditions.
Product Balance
The gasoline increase is a useful reminder to check product balance before thinking that the entire petroleum complex is tight. A crude barrel has value partly because of the products that can be sold from it, obviously, so if gasoline availability continues to improve while other distillates remain tighter, the incentive to process crude will depend on product margins and operating flexibility.
The BEA is going to be releasing third-quarter advanced GDP and September personal income and outlays for the United States at 8:30 a.m. today. For the WTI market, stronger activity would potentially reinforce the demand outlook, while persistent inflation could complicate financing conditions. This could pull in a couple of different directions.
Brent Oil Price Forecast
Every new Brent Oil analysis as it publishes, today's technical signal and key levels, live price — on one page.
See all Brent Oil forecastsTechnical Setup for WTI

For the technical outlook, we have gapped lower only to turn around and bounce. It looks like the market is still in the buy-the-dip type of attitude that we have seen for some time. The $105 level continues to be a massive barrier. At the moment, support seems to be found near the $100 level.
Brent Crude Oil
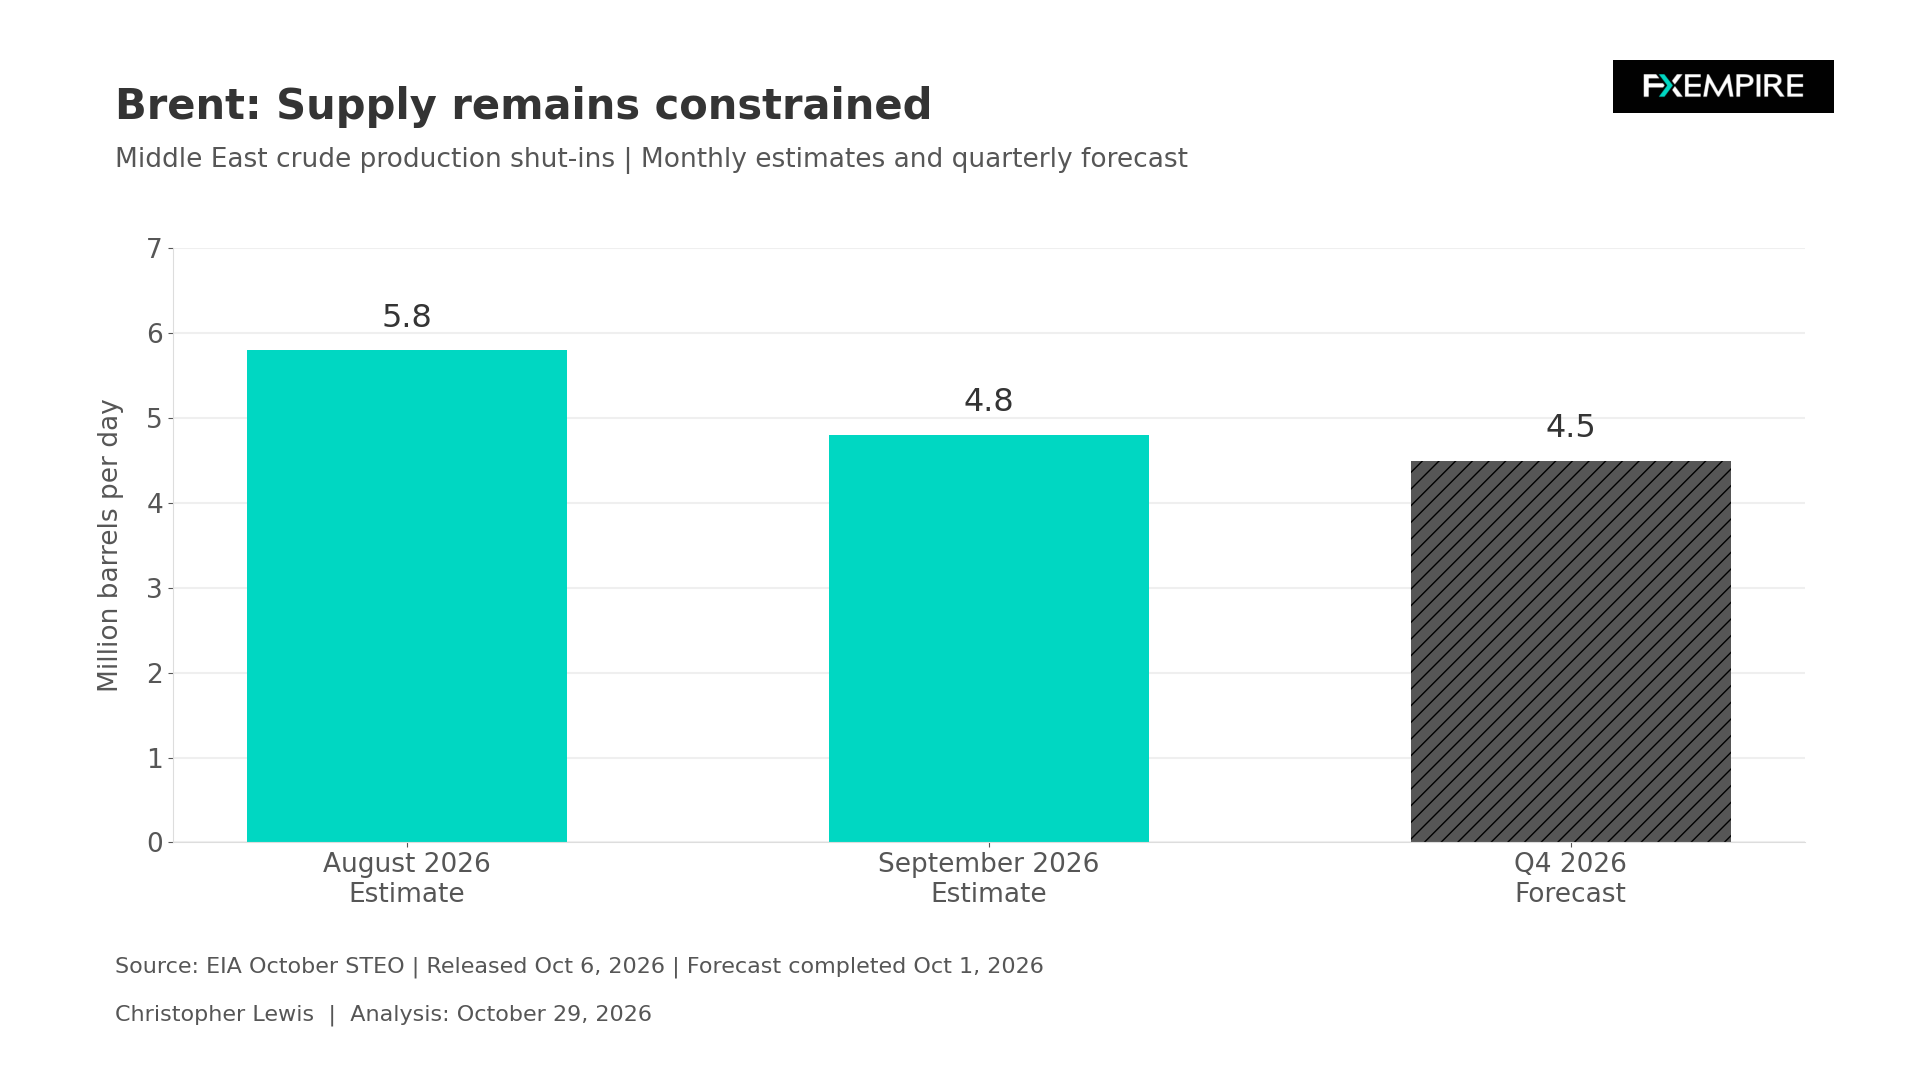
The key question for Brent is whether improving export access can outpace the depletion of available stocks. Brent continues to pay close attention to the availability and transportation of exports. The latest EIA Short-Term Energy Outlook, published October 6 and completed October 1, estimated Middle Eastern production shut-ins at 4.8 million barrels per day in September, compared to 5.8 million in August. These are simply estimates and forecasts, not a verified number.
A smaller disruption still leaves some production unavailable. Equally, an estimated constraint of supply does not necessarily prove conditions are deteriorating overnight. The chart underneath therefore separates the monthly historical estimates from the quarterly forecasts rather than presenting them as a continuous series of figures.
EIA Global Inventory Draw
The EIA estimated a global inventory draw averaging 1.9 million barrels per day in the third quarter and forecasts another 700,000-barrel daily draw in the fourth. Its projected fourth-quarter Brent spot average was $105 a barrel. This, of course, is based on several assumed conditions.
Restoring production helps only if barrels can reach refiners reliably. Shipping availability, delivery times, and insurance costs can all matter alongside the headline production number. The demand side reminds us of its importance. High delivered energy costs can encourage conservation or reduce economically attractive consumption. A supply problem can initially support crude pricing while eventually weakening the demand needed to sustain those higher prices.
Technical Outlook
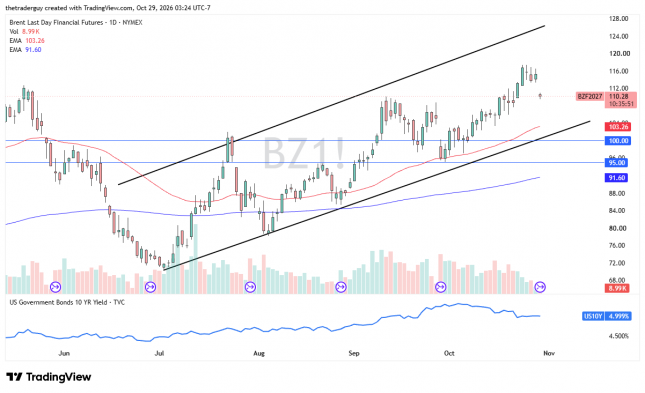
The technical analysis for crude is a bit different in the Brent grade, as the market has rolled over to the January contract with a massive gap lower. Nonetheless, despite the fact that futures traders believe that supply could be a little bit more plentiful in January, this is still a market that has plenty of support from previous moves and is sitting right on top of the $110 level as we kick off the session. There is also potential support near the $107 level and the 50-day EMA, currently at the $103.26 level. Any drop and bounce represents the buy-the-dip scenario that we have seen for so long.