


WTI Crude Oil
WTI crude oil begins the month of November with a supportive commercial crude draw, but the wider U.S. balance is somewhat mixed. The EIA’s October 28 tables, covering the week ending October 23, show commercial crude inventories of 410.6 million barrels, down 1.9 million. Gasoline increased to 209.2 million barrels from 205.3 million, while the distillate measure fell to 102.8 million from 104.3 million.
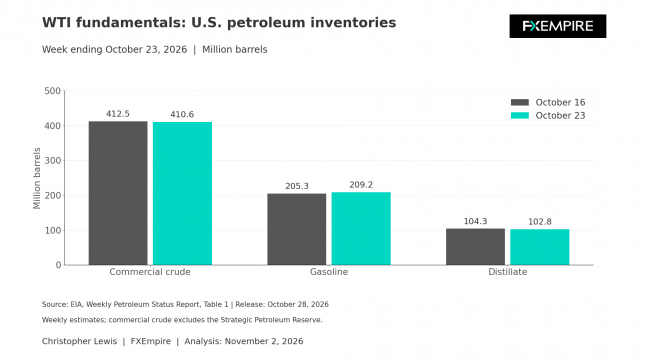
The readings are weekly estimates, not direct measurements of the conditions we find ourselves in on Monday. This distinction will matter for interpreting refinery demand, as a crude draw can tighten available feedstock, yet an accompanying gasoline build limits the argument that every part of the market is strengthening. Distillate depletion offers a certain amount of support as well, especially if subsequent reports show continued draws on that supply.
Supply Demands Attention
Supply will demand a lot of attention. Estimated U.S. production increased to 13.992 million barrels a day from a previous reading of 13.269 million. Crude exports rose to 4.854 million barrels a day from 3.442 million, while refinery inputs eased to 16.526 million.
My interpretation of this is that stronger exports are helping absorb available domestic barrels. The inventory declines should not be presented as proof that production is deteriorating. I would also point out that one weekly production increase should not be extrapolated indefinitely. The more useful test is whether output remains elevated while exports and refinery purchases continue to clear out the supply. Sustained export strength would connect WTI more closely to overseas demand.
The Weekend’s International Policy Decision Also Matters
Seven OPEC+ participants agreed on November 1 to retain September production requirements for December. That establishes a policy framework, not necessarily a verified quantity of barrels reaching buyers. The response in WTI will depend partly on whether international customers continue pulling U.S. crude.
Wednesday, November 4, is the next scheduled petroleum report catalyst at 10:30 a.m. Eastern Standard Time under the EIA’s timetable. The combination of crude, gasoline, and distillate changes, rather than the crude headline alone, will be necessary to watch.
Brent Oil Price Forecast
Every new Brent Oil analysis as it publishes, today's technical signal and key levels, live price — on one page.
See all Brent Oil forecastsTechnical Outlook

The technical look for light sweet crude on Monday is suddenly pretty poor, but there is so much in the way of support below that I anticipate a bounce between here and $95 will probably attract buyers.
Brent Crude
Brent markets’ clear new fundamental development is the Sunday OPEC+ decision. Saudi Arabia, Iraq, Russia, Kazakhstan, Kuwait, Algeria, and Oman will maintain the September 2026 required production levels for December. The next review of the policy is scheduled for November 29.
For the international benchmark, implementation is more consequential than the wording of a target. Refiners need cargoes that can be loaded, transported, and delivered on workable terms. Unchanged requirements can coexist with changing actual availability, so subsequent official production and export evidence remains essential to pay attention to.
IEA Report
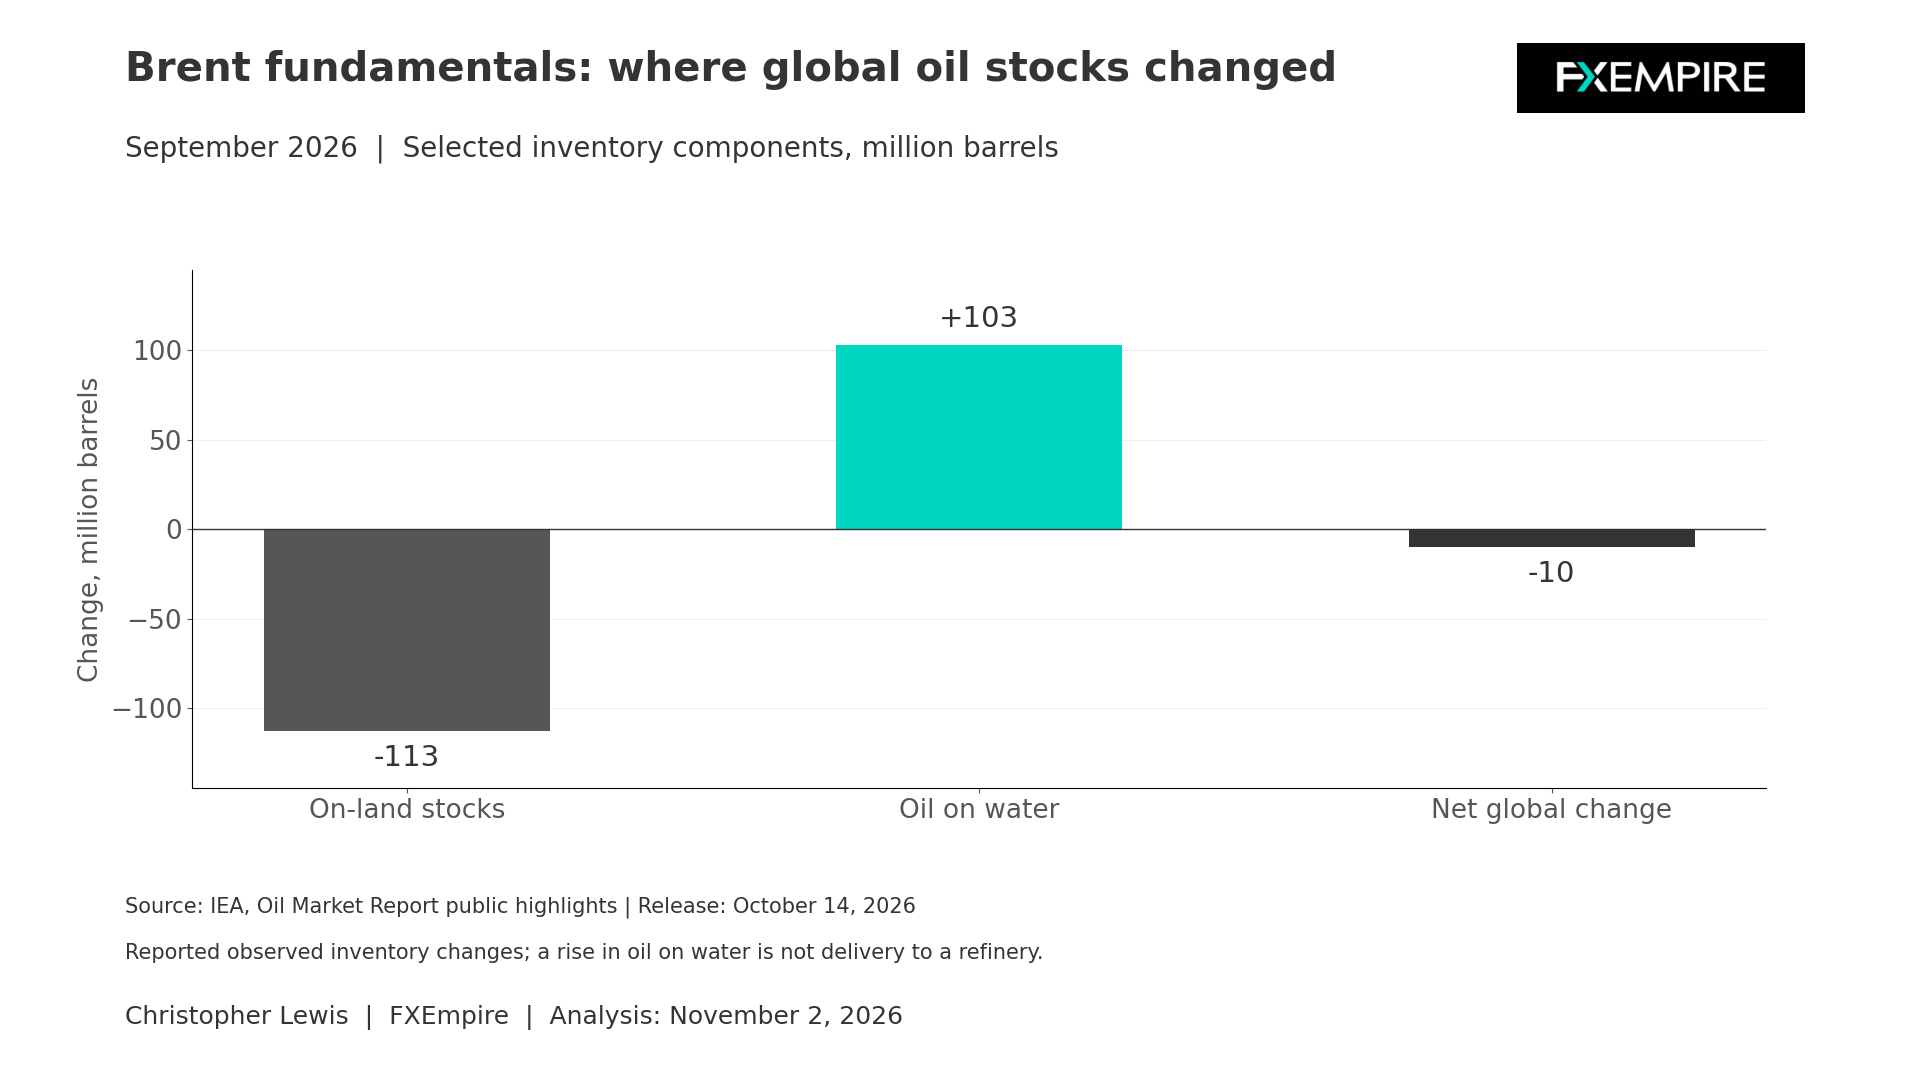
The IEA’s October 14 report provides somewhat dated context. It estimated September global supply at 102.3 million barrels per day, up 2.5 million from August. Nevertheless, observed global inventories declined by 10 million barrels: land stocks fell 113 million, while oil on water increased 103 million.
The chart below illustrates why a small net stock change can conceal a much larger change in where the supply is located. Oil on water is not the same thing as having crude available at a refinery. However, the inventory split alone will not establish that particular shipments were delayed or that transfer conditions have deteriorated today. This would require newer official evidence. The usual inference is narrower: delivery timing and inventory location can affect availability.
Demand in Focus as Well
Demand is another constraint. The same IEA report forecasts fourth-quarter demand falling 2.25 million barrels per day year over year. This is an October forecast, not a completed fourth-quarter outcome. But if actual fuel consumption proves more resilient, the projected demand weakness could overstate the relief available to the physical market.
Brent faces competing tests: whether recovering supply reaches consuming regions and whether demand weakens as forecast. U.S. exports provide a meaningful connection with WTI, but U.S. inventory changes cannot establish the global balance by themselves.
For this week, I am watching cargo availability, subsequent official supply disclosures, and Wednesday’s U.S. balances. Policy restraint would become more persuasive if inventories continue falling despite supply recovery. More available cargoes combined with softer petroleum consumption would weaken the scarcity narrative.
Trading Brent

The technical analysis at this point looks pretty weak on Monday, but there is plenty of support all the way down to at least the 50-day EMA. In that sense, Brent is very much like WTI in that it is a buy-the-dip type of scenario. I’ll be looking for a bounce to take advantage of.