


WTI Crude Oil
WTI crude faces a strong fundamental test on Wednesday as the U.S. inventory report is scheduled to be released at 10:30 a.m. Eastern. The reading will obviously have a major influence on the market, but so far we still have to look backwards for any type of reading.
Last Week’s Numbers
For the week ending October 23, commercial crude stocks fell 1.99 million barrels to 410.6 million. Gasoline inventories increased 3.9 million barrels, while distillates declined 1.5 million. The combination of those numbers matters because a crude draw alone does not establish strength across the petroleum complex. A gasoline build and distillate draw point to different product balances and warrant separate attention when the new figures arrive.
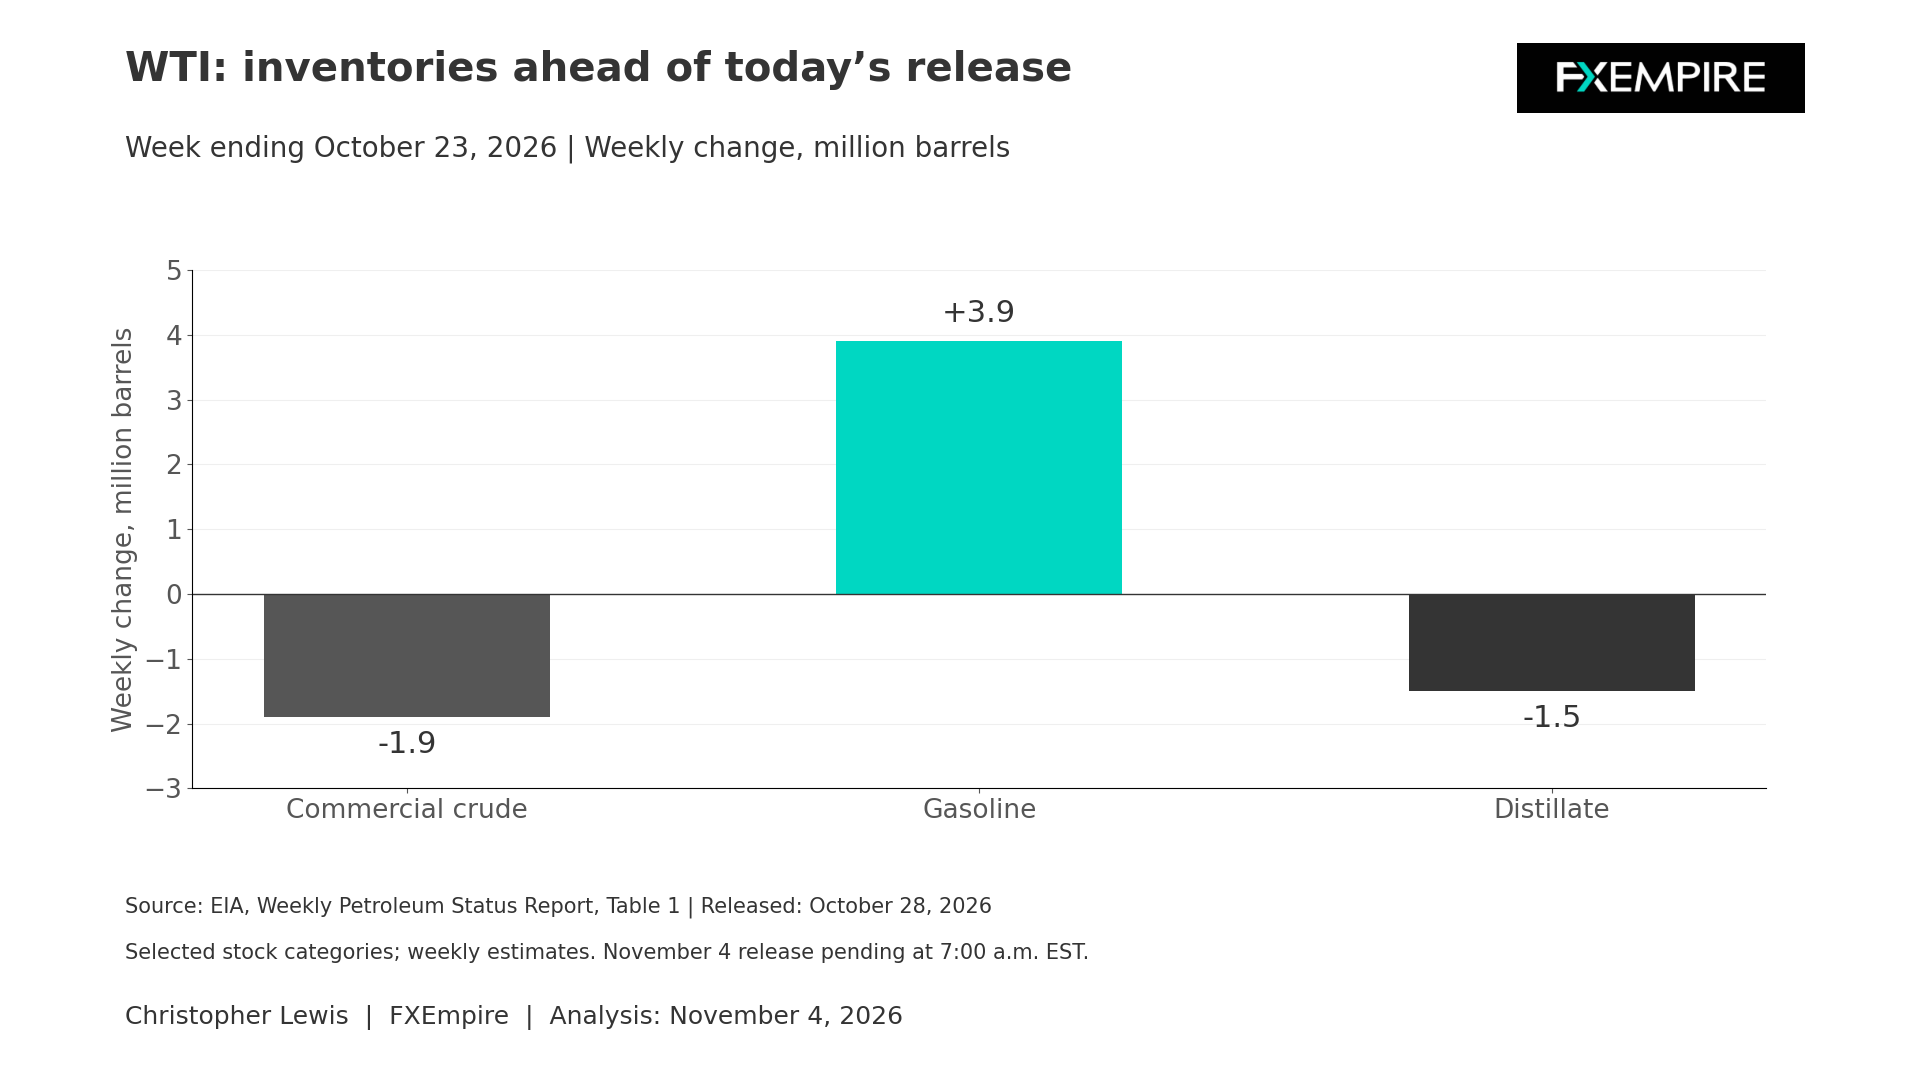
I believe at this point that the composition of today’s release will matter more than a single headline inventory number. A crude draw accompanied by falling product stocks would offer a more convincing tightening signal than a draw alongside another substantial gasoline accumulation. Conversely, product draws supported mainly by reduced refinery output would say less about final consumption.
Supply in the USA
Supply also deserves some scrutiny here. The EIA’s prior weekly estimate put U.S. crude production at 13.992 million barrels per day, up from 13.269 million during the preceding week. These are weekly estimates, not proof that the higher rate has persisted into November. A sustained recovery would replenish the domestic balance. A reversal would change the interpretation of any inventory decline.
Emergency supply is another implementation question. On October 29, the Energy Department announced awards for more than 40 million barrels from the Strategic Petroleum Reserve. An award establishes a contractual step, not confirmation that those barrels have reached commercial storage or refineries. WTI enters the session with a bit of a mixed-dated inventory picture, but with the inventory number imminent, things could change quite rapidly.
Brent Oil Price Forecast
Every new Brent Oil analysis as it publishes, today's technical signal and key levels, live price — on one page.
See all Brent Oil forecastsFrom a Technical Analysis Standpoint
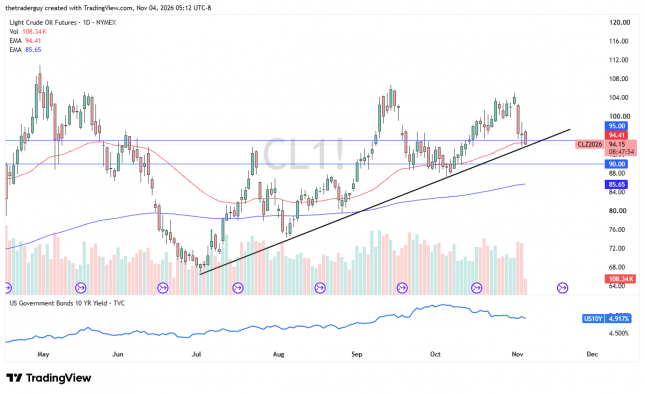
From a technical analysis standpoint, it’s worth noting that WTI is sitting on not only a trend line, but also the 50-day EMA. Any bounce at this point in time could be thought of as a technically bullish signal by those chart readers out there who focus on technical analysis only.
Brent Crude Oil
Brent’s international backdrop remains dominated by the difference between diplomatic activity and a completed agreement. Qatar’s foreign minister said on November 3 that its efforts to narrow differences between Washington and Tehran were continuing, but it could not announce a specific breakthrough. A Qatari delegation had visited Tehran on Monday, November 2, and returned that evening. This is evidence of active negotiations, but no confirmation has emerged that shipping risks have disappeared.
For Brent, the practical questions concern whether cargoes can be moved reliably, whether voyage times normalize, and whether buyers can obtain the grades they need. A constructive diplomatic announcement could reduce perceived disruption risk, but the physical balance would still require completed shipments.
OPEC Statement
OPEC’s November 1 statement provides a separate policy reference. Seven participating countries agreed to maintain their September 2026 required production levels for the month of December, and another meeting is scheduled for November 29. These are production requirements rather than actual measured output, though.
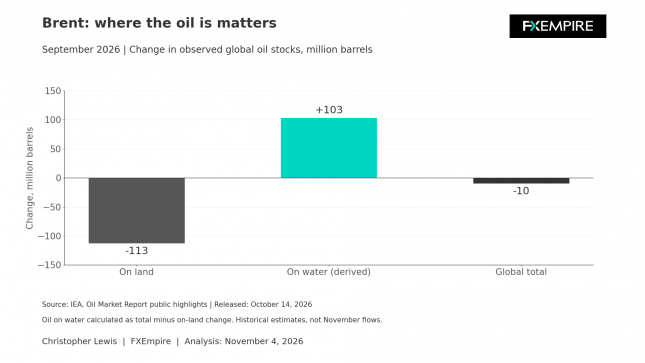
Inventory location will also matter. The IEA’s October 14 report estimated that observed global stocks declined by 10 million barrels in September, while on-land stocks fell 113 million. The difference implies a 103 million-barrel increase in oil on water. The accompanying chart presents that arithmetic explicitly. It is a historical September estimate, not a November cargo-flow update.
My reading is that the relatively small global decline masks a much larger relocation of supplies. Oil afloat cannot necessarily meet a refinery’s immediate needs as readily as accessible onshore stocks. However, cargoes arriving and unloading could subsequently improve local availability. Today’s U.S. inventory release can influence pricing through the Atlantic Basin trade, but it cannot settle the separate question of international transport reliability. Confirmed shipping normalization would weaken the disruption narrative; further verified interruptions would reinforce it.
Looking at the Chart
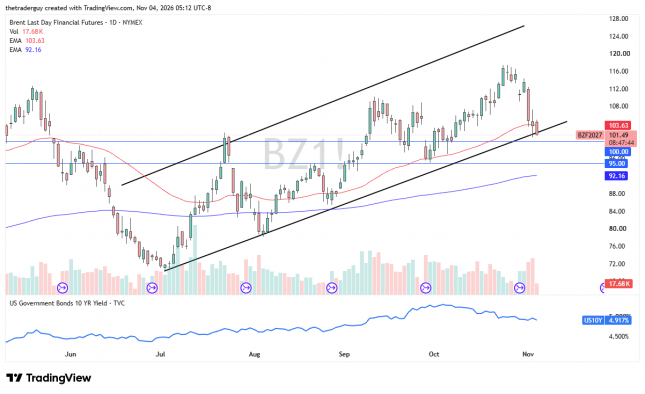
From a technical analysis standpoint, Brent finds itself at the bottom of a channel and sitting just a bit above the $100 level. This is an area that technical traders may be interested in, but we probably need to get through the inventory announcement in America before we start to see bigger moves. Keep in mind that this is a market that is highly sensitive to the headlines coming out of the Middle East, so that is worth paying attention to as well.