Bullish Reversal Emerges at Support
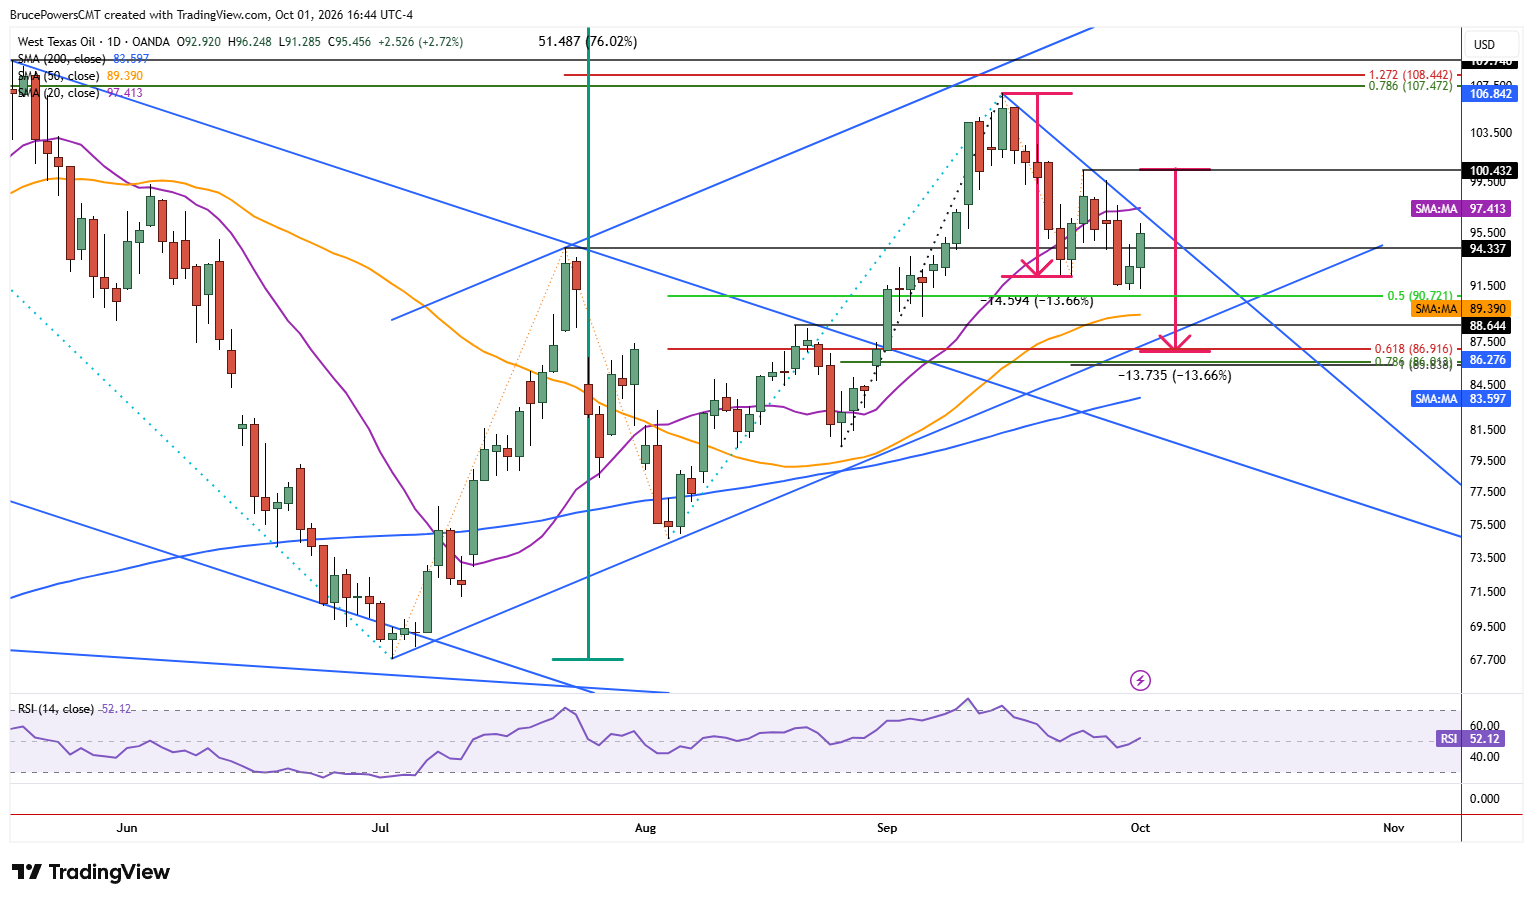
WTI crude oil triggered a one-day bullish reversal signal on Thursday, reaching a high of $96.25. That short-term sign of strength followed a third test of support near this week’s low of $91.20. That low is now key near-term support, as a drop below will put crude oil on track to test lower support around the interim swing high of $88.64 from August and the 50-day moving average near $89.39. Further down is a measured move target near $86.81 and the 78.6% Fibonacci retracement of the prior advance at $86.01.

$97.68 Becomes Key Resistance
Thursday’s advance is occurring within a bearish trend structure and below the 20-day moving average near $97.41. That indicator was confirmed as resistance on Tuesday with a high of $97.68, but it is now more closely aligned with the downtrend line, adding to the significance of the price zone. Therefore, a decisive advance above $97.68 could lead to a test of resistance near the recent lower swing high of $100.43. A daily close above that level may begin to clarify the near-term outlook for crude oil, but for now resistance is anticipated during signs of strength unless $100.43 is decisively reclaimed.
Weekly Chart Offers Earlier Signal
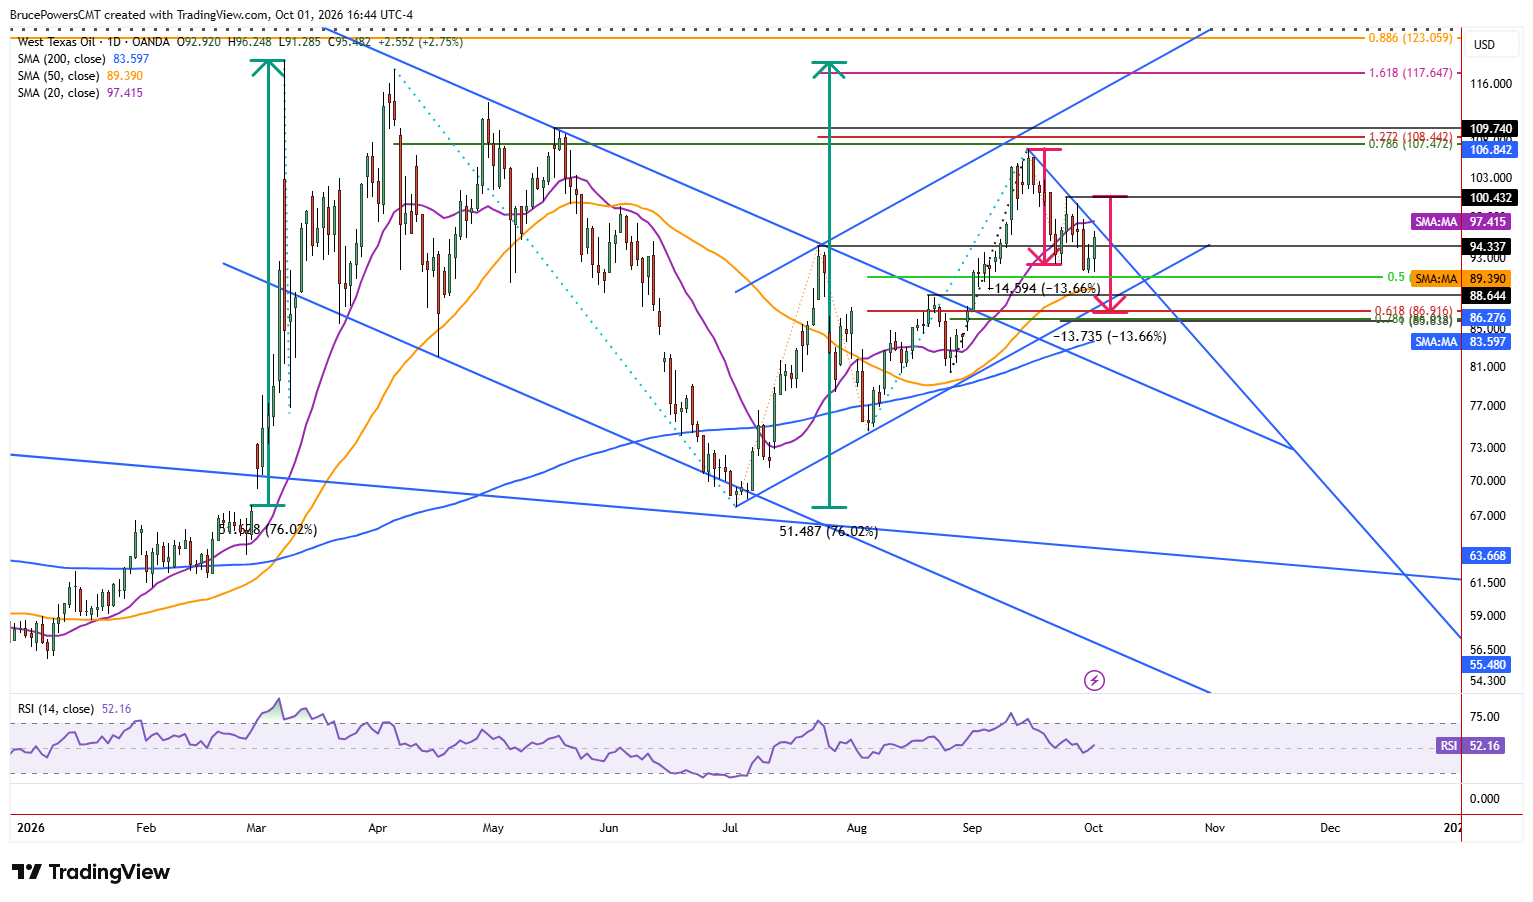
Having said that, the above analysis is from the daily chart. The weekly chart shows a new lower weekly high of $99.64 and a lower weekly low of $91.20, but the weekly candle has not yet closed. So, a breakout above this week’s high would provide a bullish reversal signal on the weekly chart and would provide an earlier sign of strength than seen on the daily timeframe.
Bearish Structure Remains Intact
Until there are clear signs of strength, starting with a decisive rally above $97.68, crude oil remains in a bearish corrective structure. This keeps lower targets in sight, awaiting additional information. If resistance is tested at the 20-day moving average and sellers take back control, this week’s low will be at risk of being broken on the way to lower potential support areas.
If you’d like to know more about how to trade crude oil, please visit our educational area.