


Consolidation at Critical Support
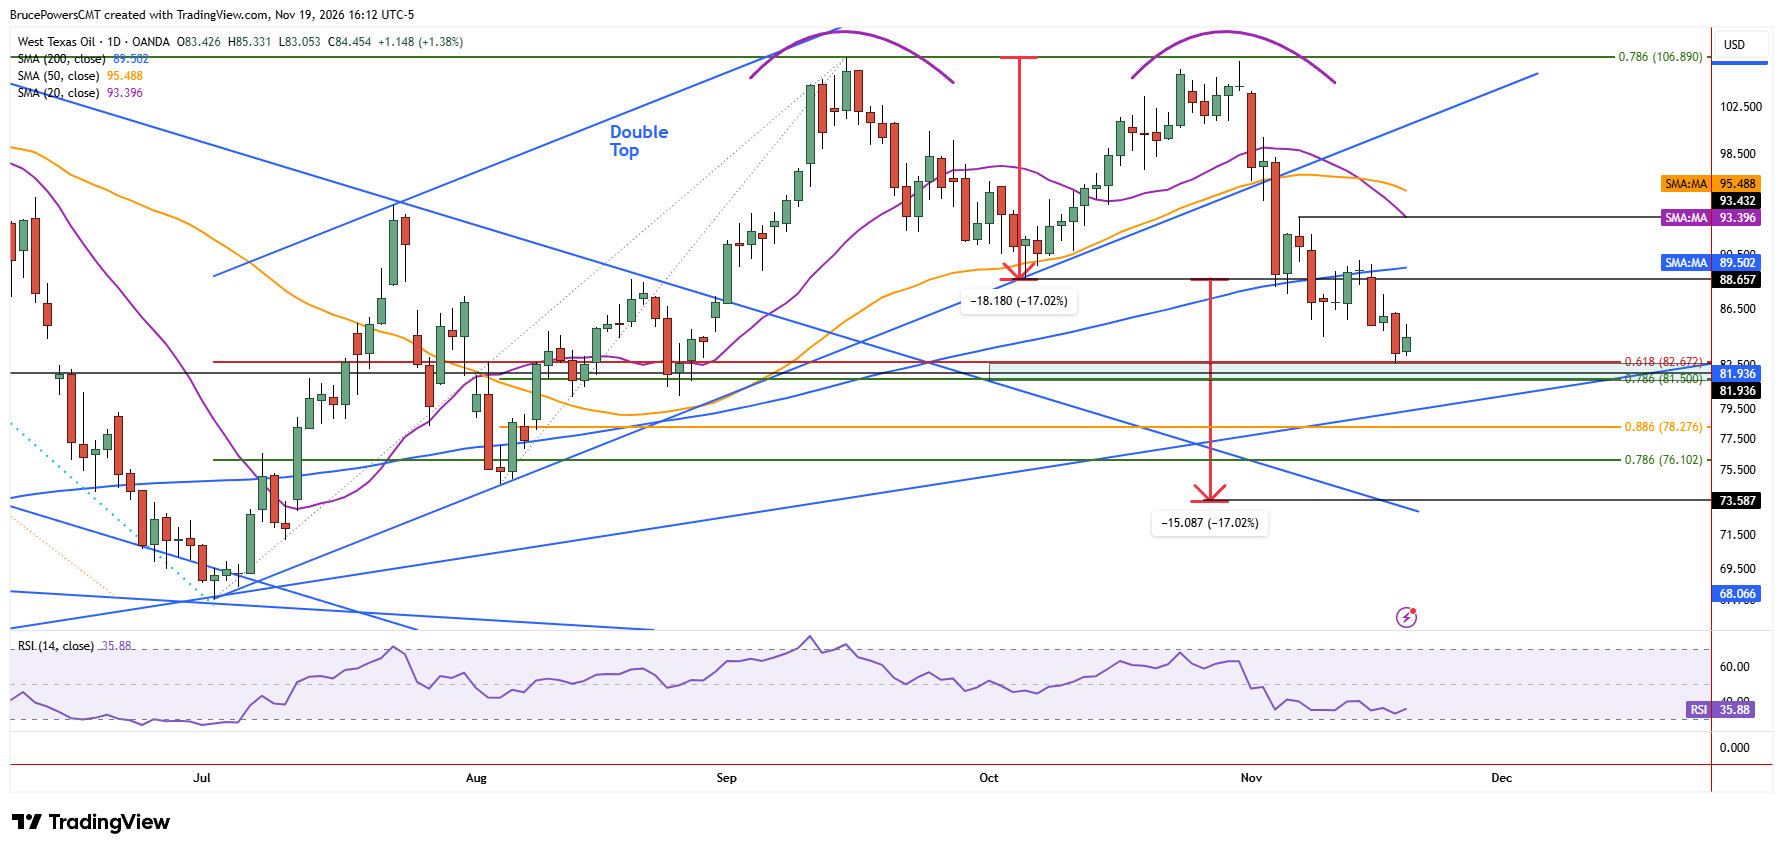
WTI crude oil consolidated on Thursday, establishing a relatively tight range from $83.06 to $85.33. That range was within Wednesday’s trading range, suggesting a pause in the decline that could result in a bounce or bearish continuation. During Wednesday’s session, crude oil declined to a new corrective low of $82.61, which tested the top of a potential support range from $82.67 to $81.50. That range is defined by the 61.8% Fibonacci retracement and the 78.6% retracement, respectively, and is further reinforced by an April low at $81.94 and a June high.
Bearish Signals Build Across Timeframes
Recent bearish signals have accumulated, including a break below the 50-day moving average two weeks ago and a decline below the 200-day moving average last week, which also triggered a breakdown from a large double top pattern. In addition, the first pullback following these breaks resulted in a successful test of the 200-day moving average and double top breakdown area as resistance, establishing a lower swing high of $90.05 last Friday. Further, on the weekly chart, both the 20-week and 50-week moving averages have been broken to the downside.
$73.59 Downside Objective Comes Into View
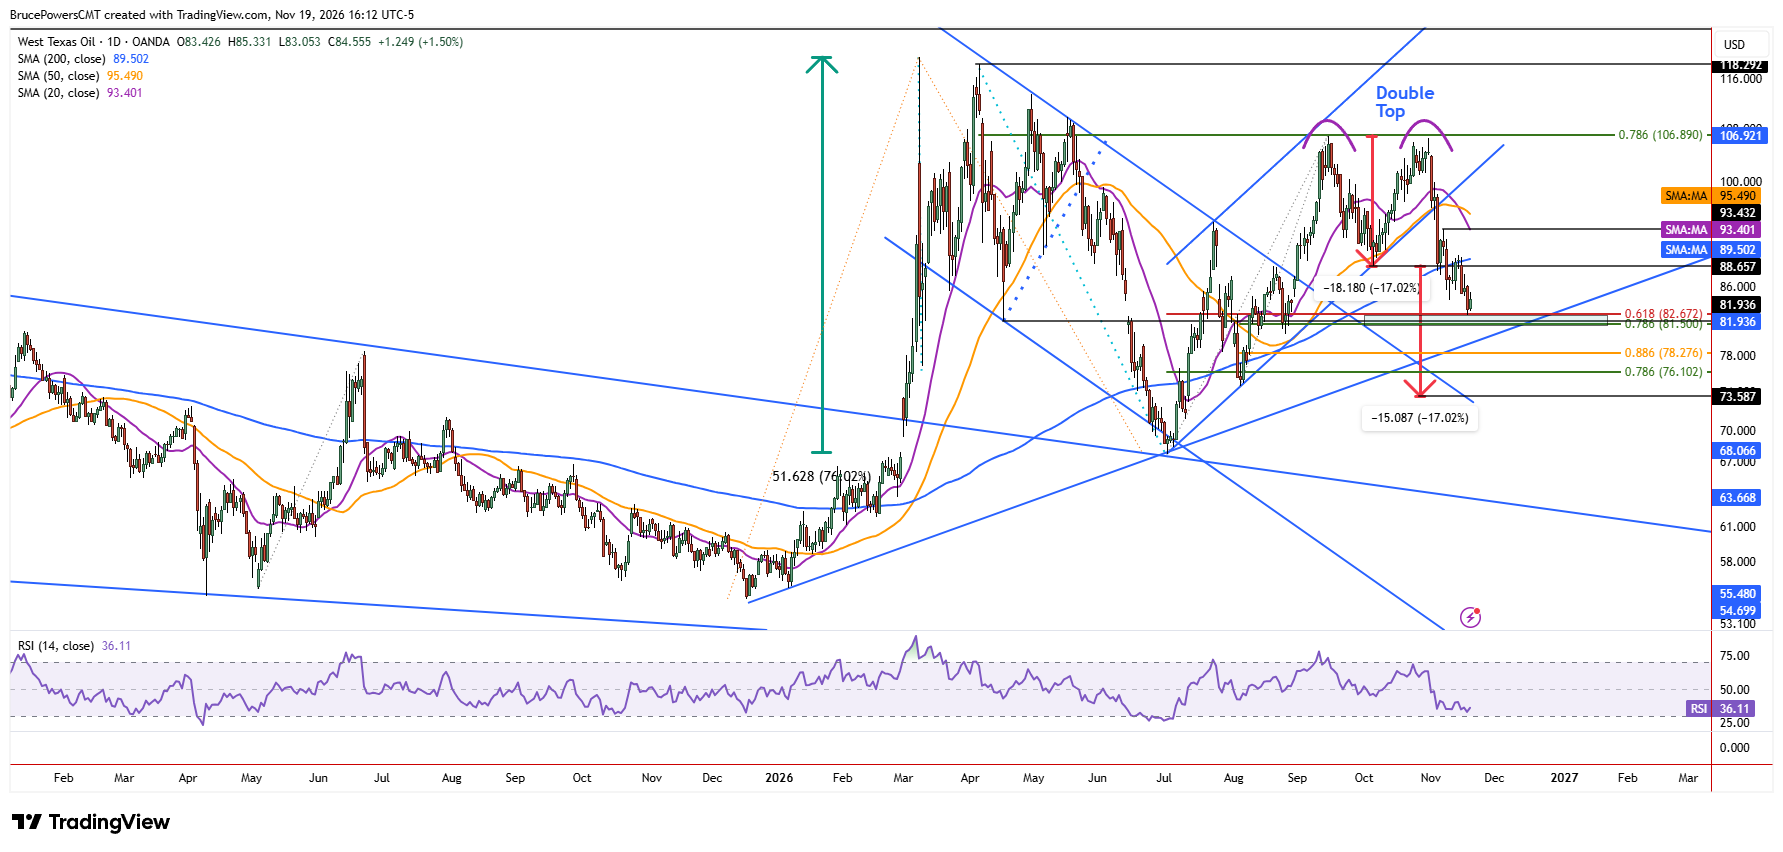
The accumulation of recent bearish signals suggests that sellers could retain control and push crude oil below the lower boundary of the current defined support range at $81.50. Notably, an estimated downside objective from the double top is near $73.59, based on a percentage decline equal to the height of the formation. Nonetheless, if crude oil falls below $81.50 and continues lower, support could be found near a rising trendline, an 88.6% Fibonacci retracement level at $78.28, or a 78.6% Fibonacci retracement at $76.10.
Bullish Recovery Requires Key Reclaims
Alternatively, the $82.67-$81.50 support range could hold and potentially lead to a bottom. But first, the 200-day moving average near $89.50 would need to be reclaimed, along with the prior swing high of $90.05. A period of consolidation above that zone and the rising trendline could occur below the 200-day moving average. Although the current technical picture favors sellers, identifying lower potential support targets does not mean they will necessarily be tested. Their relevance depends on whether bearish signals persist and the current support range ultimately fails.
If you’d like to know more about how to trade crude oil, please visit our educational area.