


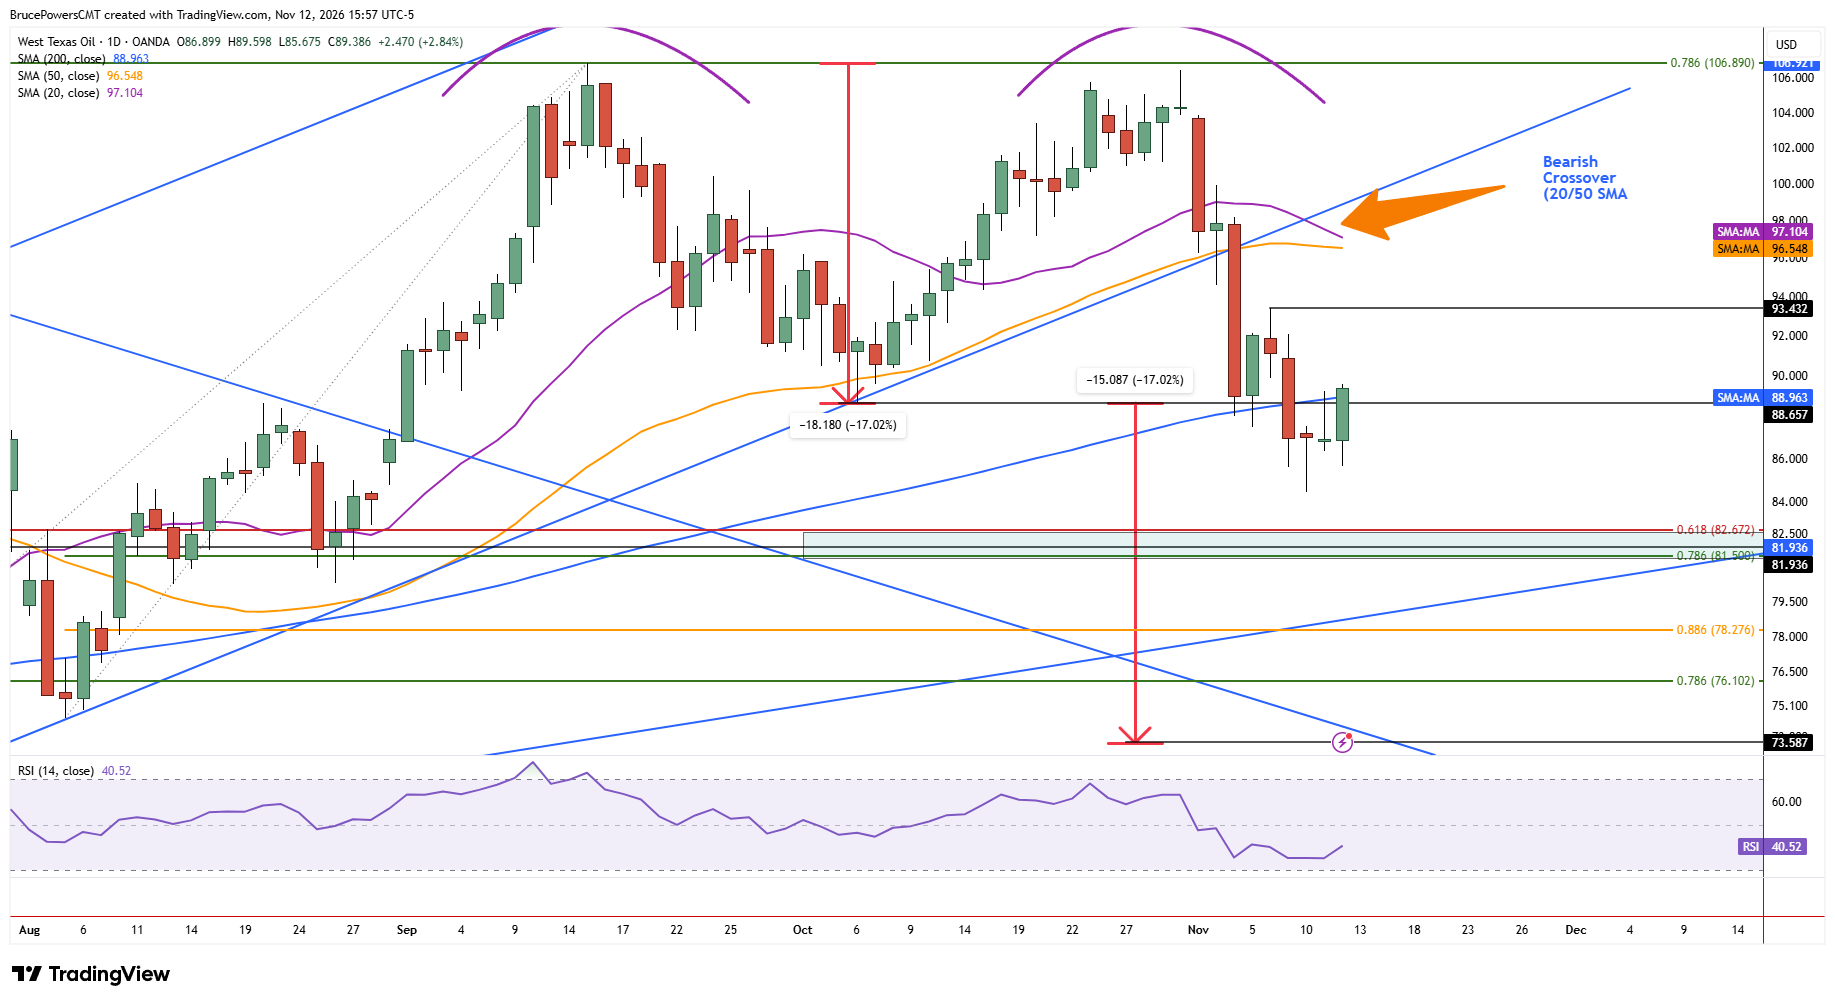
WTI crude oil remained under bearish pressure on Thursday, following Monday’s break below the 200-day moving average for the first time since early August. Support was subsequently found at a low of $84.44 the next session, followed by a bounce to test prior support as resistance. The breakdown increased the risk of continuation of the decline that followed the second recent peak of $106.45 at the end of October. It showed a change in character for crude oil, reinforced by a bearish reversal signal that triggered below the prior swing low of $88.66, which also represents the neckline of a bearish double top pattern.
Bearish Breakdown Changes Market Character
Nonetheless, two previous declines tested support near the 200-day moving average, and each time there was a brief drop below the average before it was reclaimed, followed by an advance. This time, similar behavior is possible, but the double top adds to the downside risk. Moreover, a pullback to test resistance generated a lower swing high at $89.24 on Wednesday, near the 200-day moving average. After that high, sellers regained control, and the session ended with a bearish doji candlestick pattern and a close near the low of the session. Further weakness triggered a downside break on Thursday below $86.34.
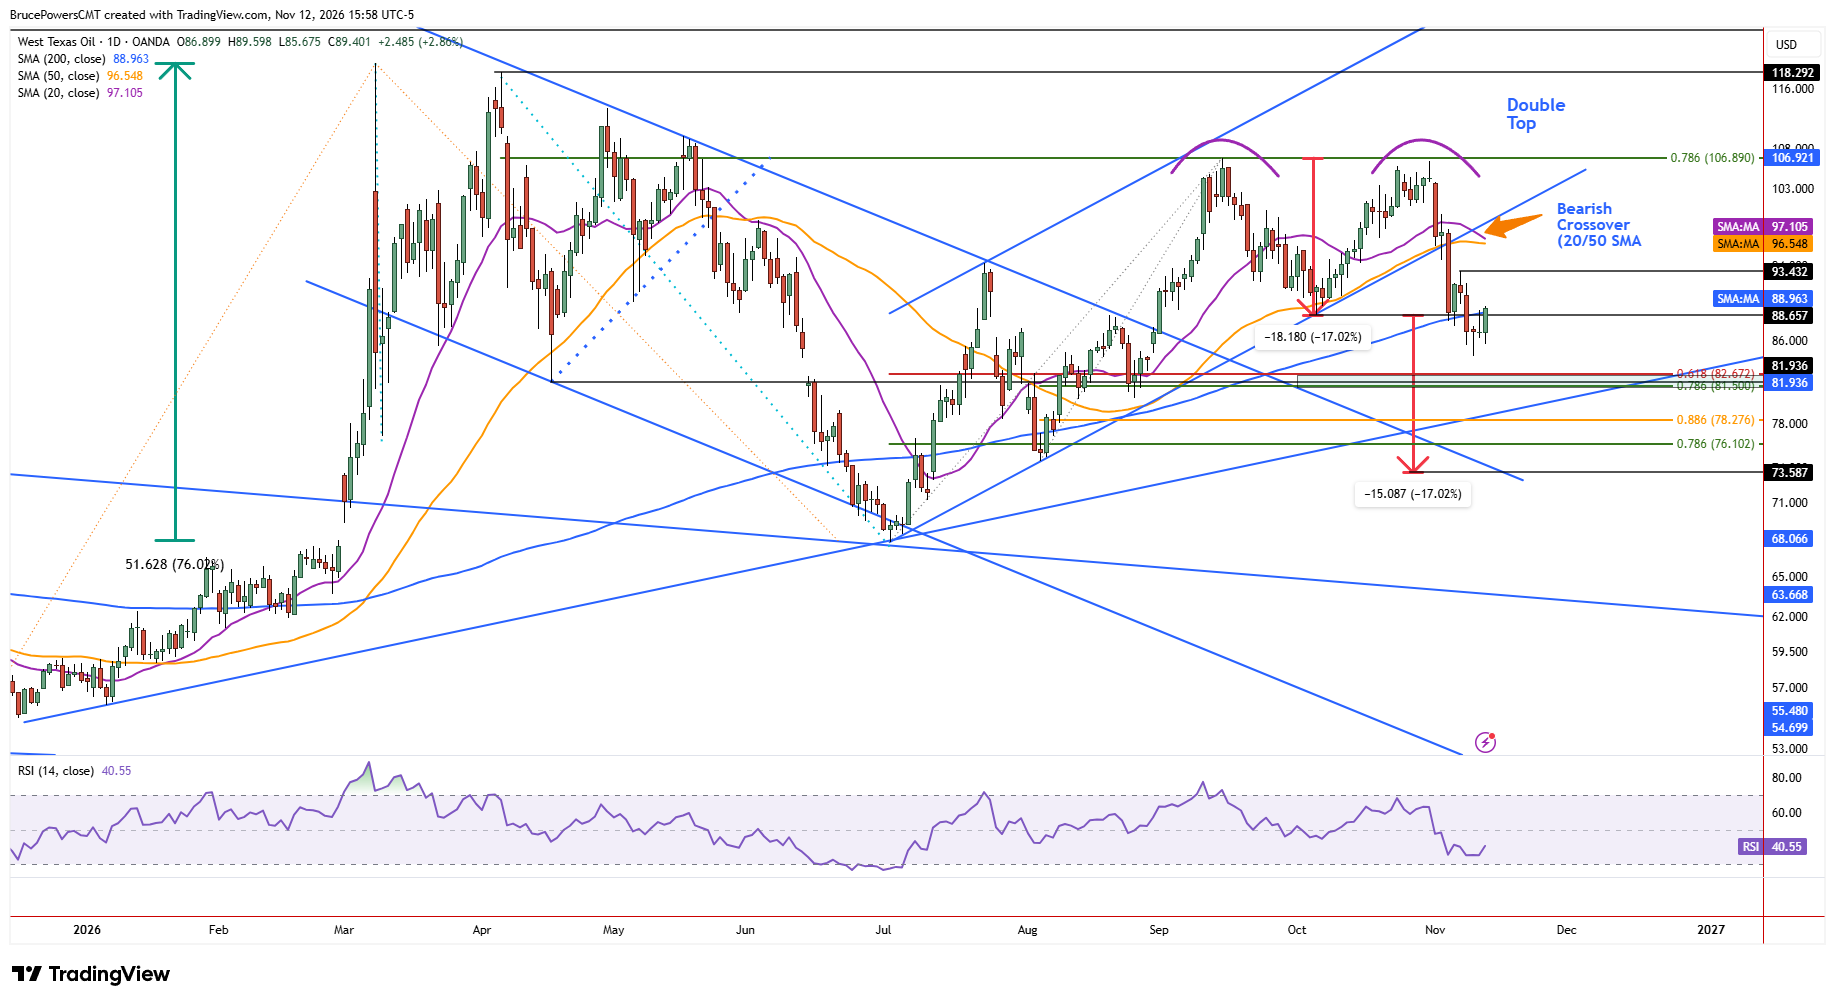
Previous Recoveries Offer a Counterargument
Thursday’s high of $89.60 is now key short-term resistance. A recovery of that level would provide a bullish reversal signal and potentially confirm a reclaim of the 200-day moving average, a sign of strength. The 200-day moving average is now near $88.95 and has been reclaimed but it is not yet clear that will be sustained. A sustained recovery would first target a more significant lower swing high at $93.43 from Friday, followed by a test of resistance near the October 26 daily low of $96.26. Both the 20-day and 50-day moving averages reinforce that potential resistance level.
Reclaiming Resistance Is First Test for Buyers
Key support is at Tuesday’s low of $84.44, and if it fails to hold, a confluence support zone is indicated from $82.67 to $81.40. There is also a rising trendline that may enhance this price zone, depending on when and how quickly it is reached. That trendline has significance and therefore presents a potentially formidable dynamic support zone. However, a break below Tuesday’s low would increase the likelihood of a deeper decline toward this confluence support, reinforcing the bearish implications of the recent breakdown below the 200-day moving average.
If you’d like to know more about how to trade crude oil, please visit our educational area.