


200-Day Moving Average Keeps Pressure on Oil
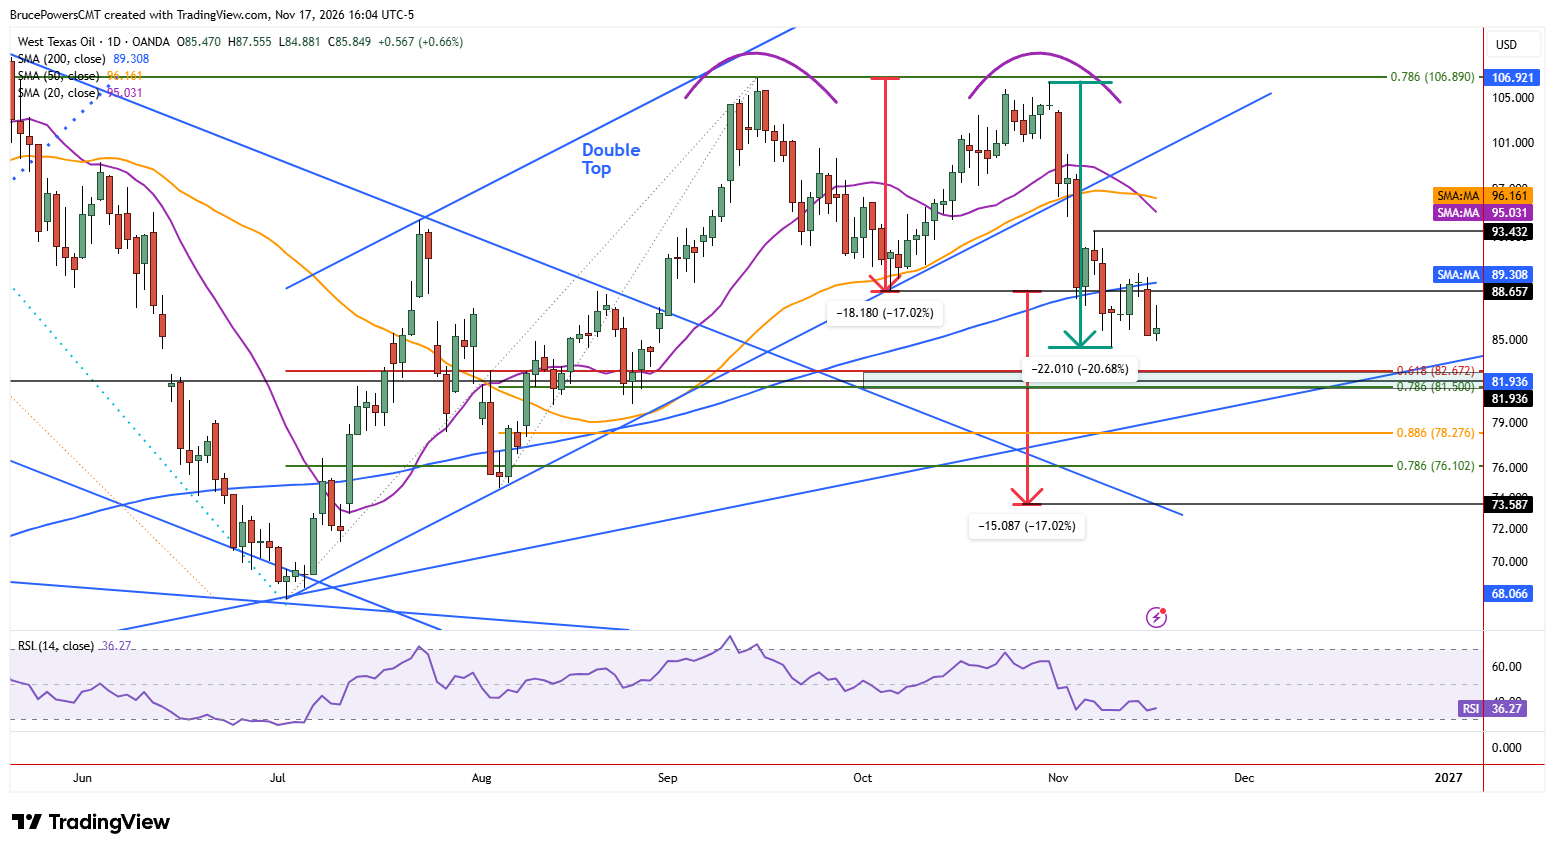
WTI crude oil remains under pressure below its 200-day moving average, with several bearish technical signals pointing to the potential for a deeper correction. Tuesday’s session was the sixth below key resistance represented by the 200-day moving average, currently near $89.21. A narrow-range day, covering $84.88 to $87.56, developed on Tuesday, after a brief decline below Monday’s low of $85.25. A break below the 200-day moving average triggered last Monday, leading to a new low of $84.44, which remains the low for the current decline that followed a second top at $106.45 in late October. At the low, crude oil was down by 20.7% from that October high.
Failed Recovery Reinforces Bearish Structure
Subsequently, a rally to test resistance near the 200-day moving average led to a lower swing high of $90.05 on Friday, followed by a bearish reversal to a four-day low of $85.25 on Monday. In addition, weakness was reinforced by a close near the low of the session and a new daily closing low for the bearish trend. Once prior support switches to resistance and is followed by selling, it reinforces the potential for a continuation to lower prices.
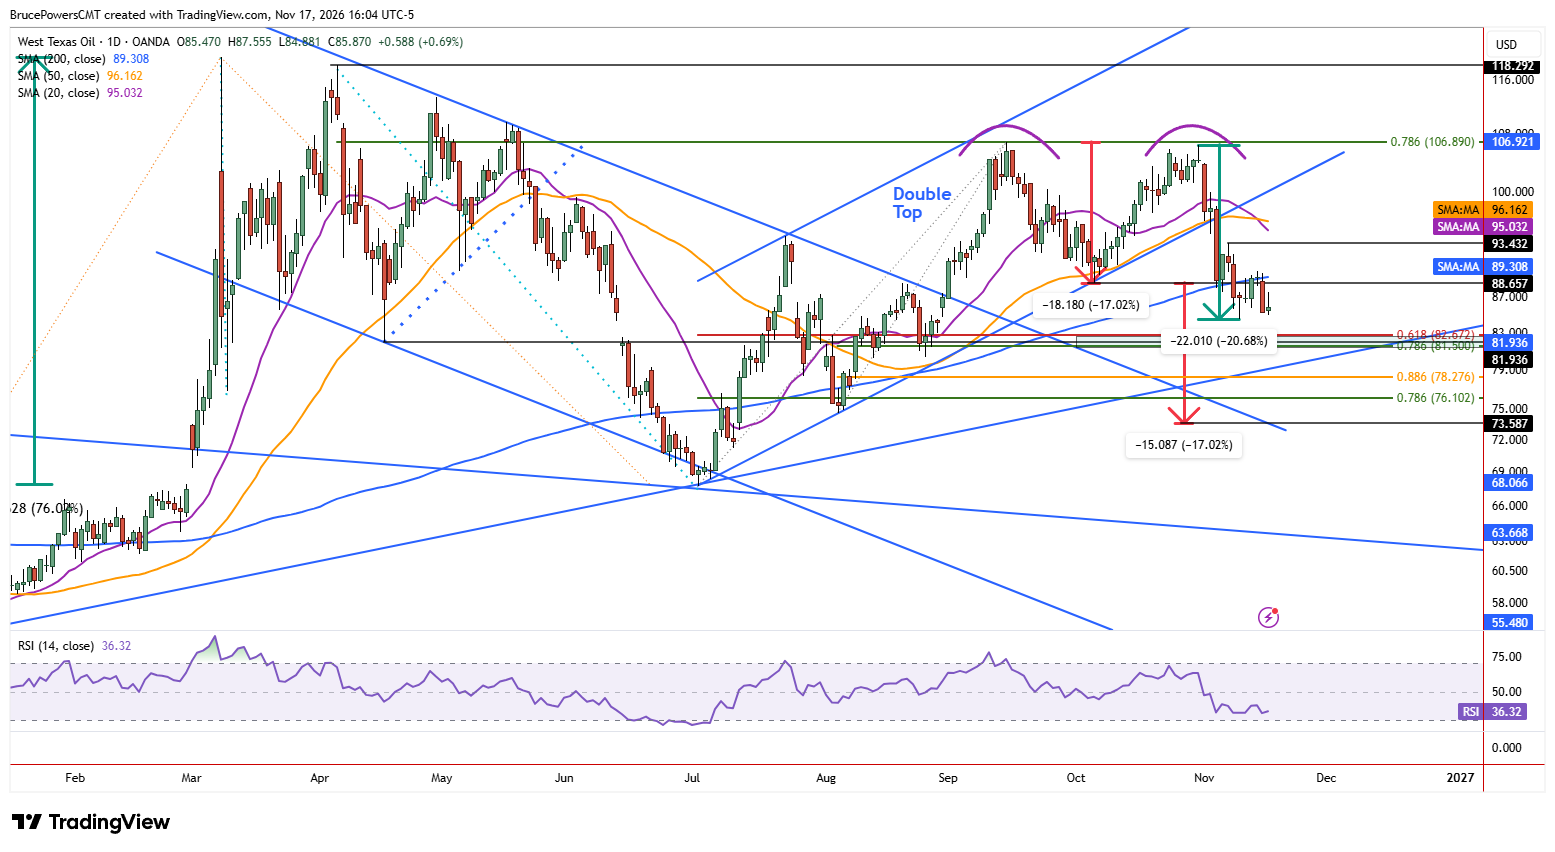
But bearish technical signals don’t end there. Last Monday’s decline also triggered the breakdown from a bearish double-top pattern below the neckline at $88.66, which is also a higher swing low for the prior uptrend. That prior support level was then tested as resistance during last week’s advance, confirming the transition to resistance.
$84.44 Becomes Critical Breakdown Trigger
Therefore, a decisive decline below $84.44 would signal a continuation of the correction, while a decisive rally above $90.05 would show buyers regaining control. The bullish case would first be indicated by a decisive advance above $90.05. If that level is exceeded, last week’s high of $92.10 is the next upside target, followed by a lower swing high on the daily chart at $93.43. Higher up is the falling 50-day moving average near $96.18 and a daily high of $98.19.
On the downside, a bearish continuation signal would trigger below $84.44, putting crude oil on track to test support at a key price zone from around $82.67 to $81.50. In addition to two Fibonacci levels, that range includes the swing low from April at $81.94. A break of this support zone would further reinforce the deeper bearish correction suggested by crude oil’s inability to reclaim the 200-day moving average.
WTI Crude Oil Price Forecast
Every new WTI Crude Oil analysis as it publishes, today's technical signal and key levels, live price — on one page.
See all WTI Crude Oil forecastsIf you’d like to know more about how to trade crude oil, please visit our educational area.