


Bearish Breakdown Strengthens
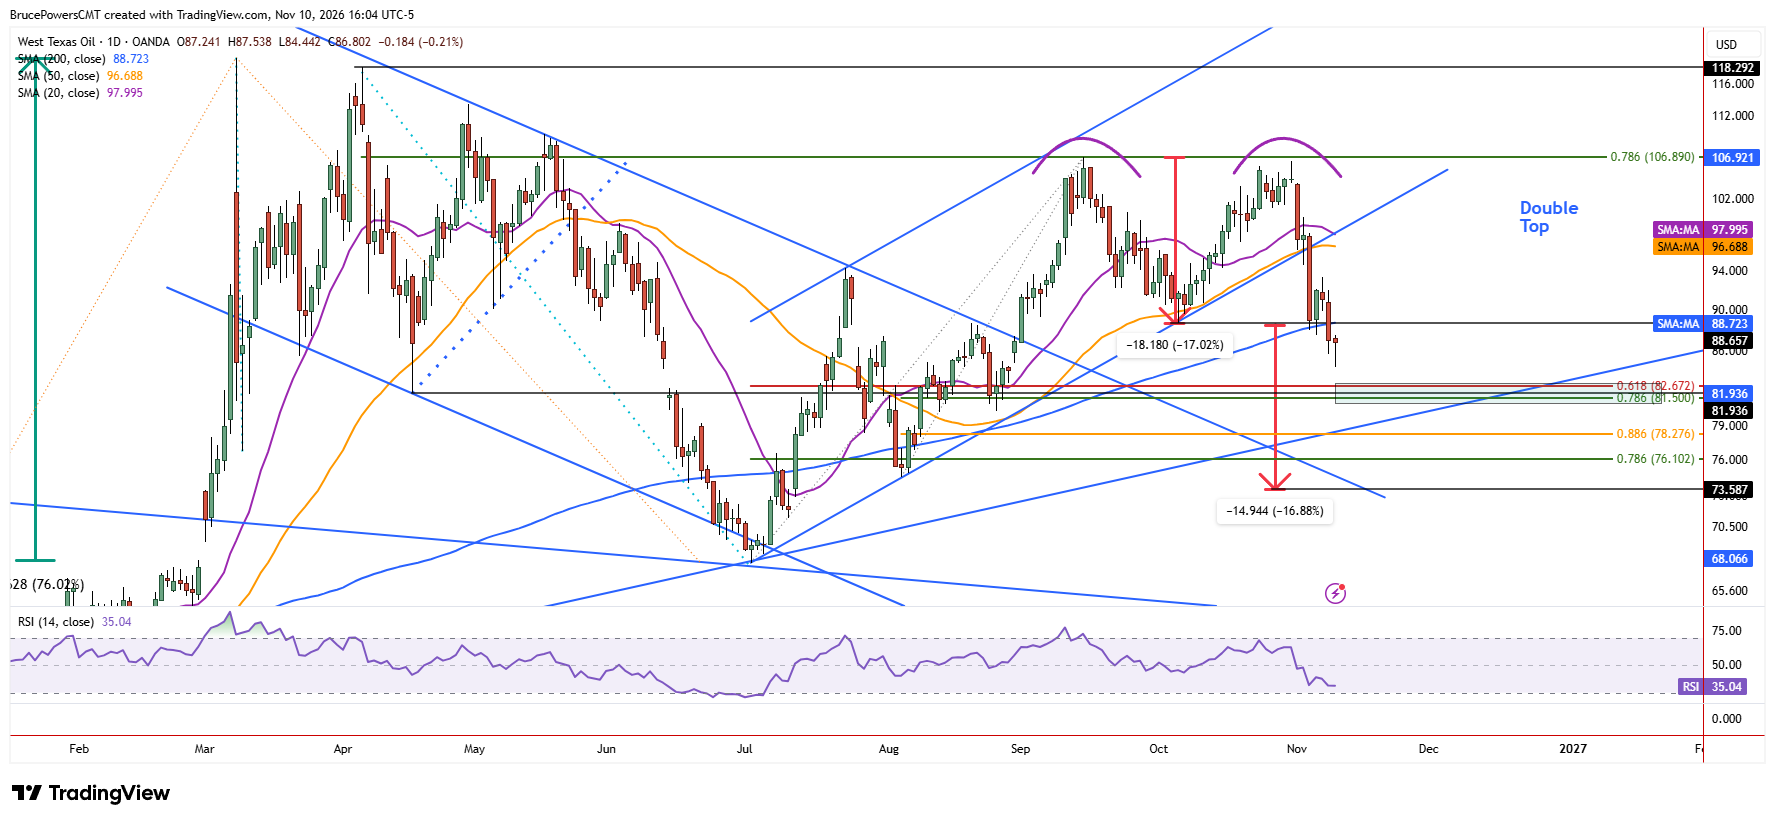
WTI crude oil continued to show sellers in control on Tuesday, extending its decline to a 50-day low of $84.44. This followed new bearish signals on Monday, with a double-top pattern triggered below $88.66 and the 200-day moving average. A sustained decline below the 200-day average, currently near $88.72, would put lower levels at risk of being tested. Since that average was reclaimed during the advance in August, its failure as support shows weakening underlying demand and reinforces the bearish shift in the technical outlook.
Fibonacci Levels Define Next Support Zones
Although the double top shows a measuring objective around $73.59, the next potential support zone looks to be from $82.67 to $81.50. The range combines two Fibonacci retracement levels with prior swing highs and lows. Further down is a rising trendline marking potential dynamic support. Near the trendline is the 88.5% Fibonacci retracement of the prior advance at $78.27, which is reinforced by two weekly lows near $78.05.
Weekly Chart Adds Weight to Support Outlook
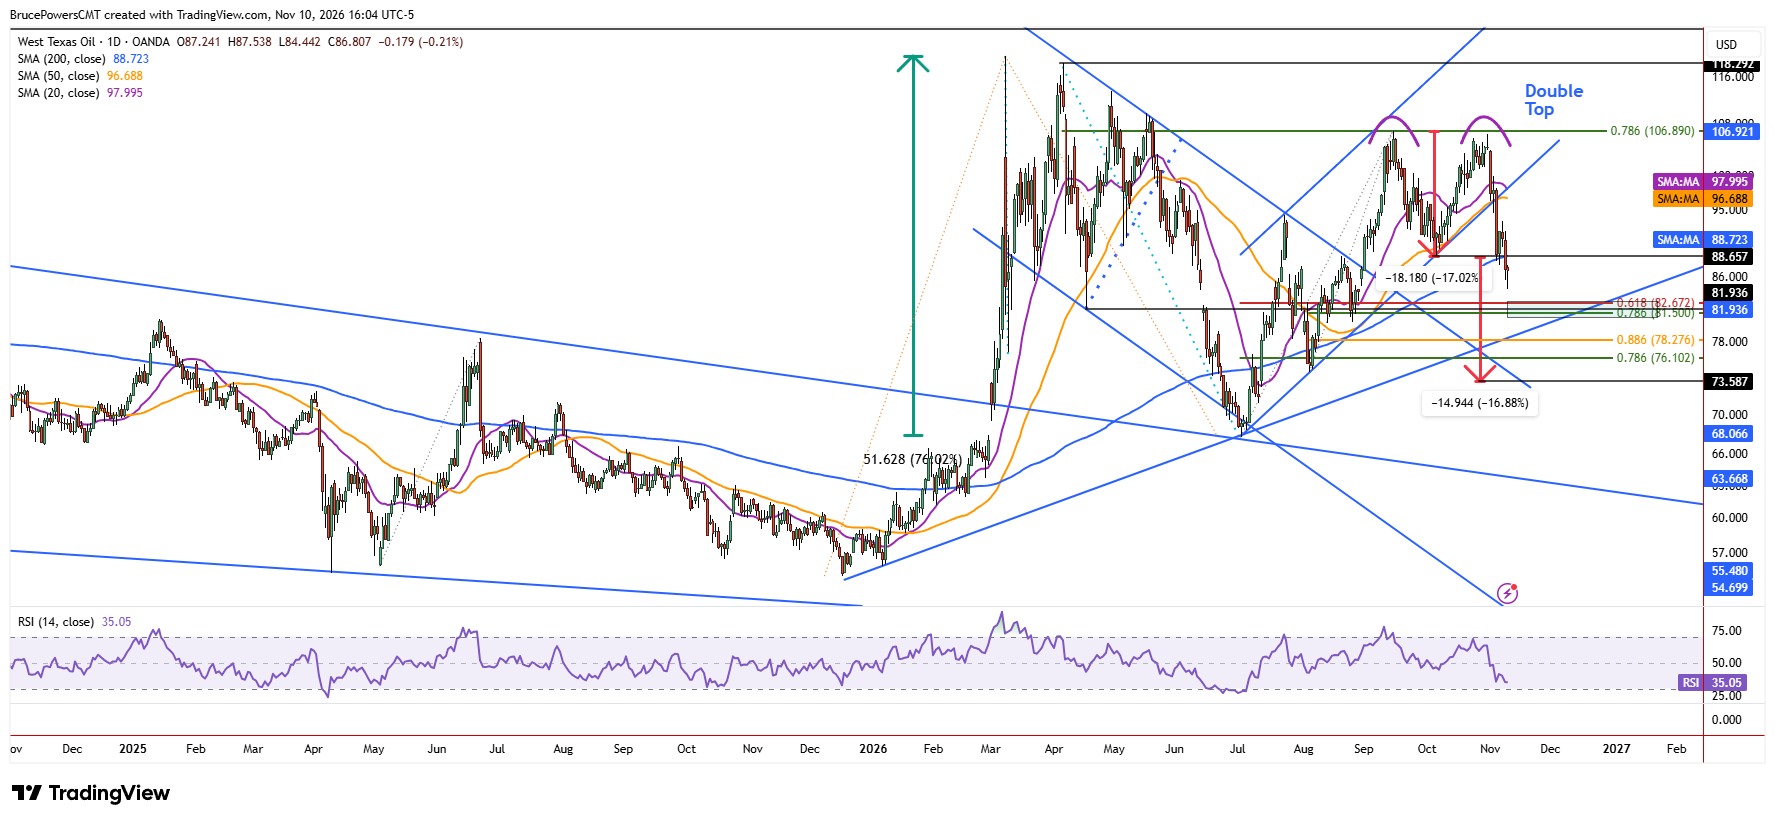
In addition, the weekly chart shows dynamic support near the rising 50-week moving average, currently near $84.00. Given the new bearish signals, this average is also at risk of being broken. This adds to the significance of the $82.67 to $81.50 range. One possible scenario that could unfold is a test of support in that range, followed by a relatively quick reclaim of the 50-week moving average. Such a recovery would suggest that buyers are beginning to regain some control despite the recent bearish signals.
Recovery Levels and Resistance Risks
On the upside, key levels are the neckline of the double-top pattern at $88.66, followed by a lower swing high of $93.43. Last week, crude oil triggered a decisive break below a rising trend channel, concurrent with a drop below the 50-day moving average. Although this bearish signal suggested lower prices, there could be a more substantive pullback to test prior support as resistance than the one represented by the $93.43 lower swing high. Of course, such a test of resistance would first need to reclaim the 200-day moving average.
If you’d like to know more about how to trade crude oil, please visit our educational area.