


Short-Term Exhaustion Near Major Resistance
WTI crude oil continued to see short-term weakness on Tuesday following a new high for the advance of $105.78 last week. The advance had exceeded the 78.6% Fibonacci retracement of the prior decline with only one minimal pullback and reached resistance near the prior swing high of $106.84. This suggests short-term trend exhaustion and the potential for a deeper retracement than seen so far. This would be healthy for the larger trend, especially if crude oil is to mount another rally and challenge the $106.84 high again.
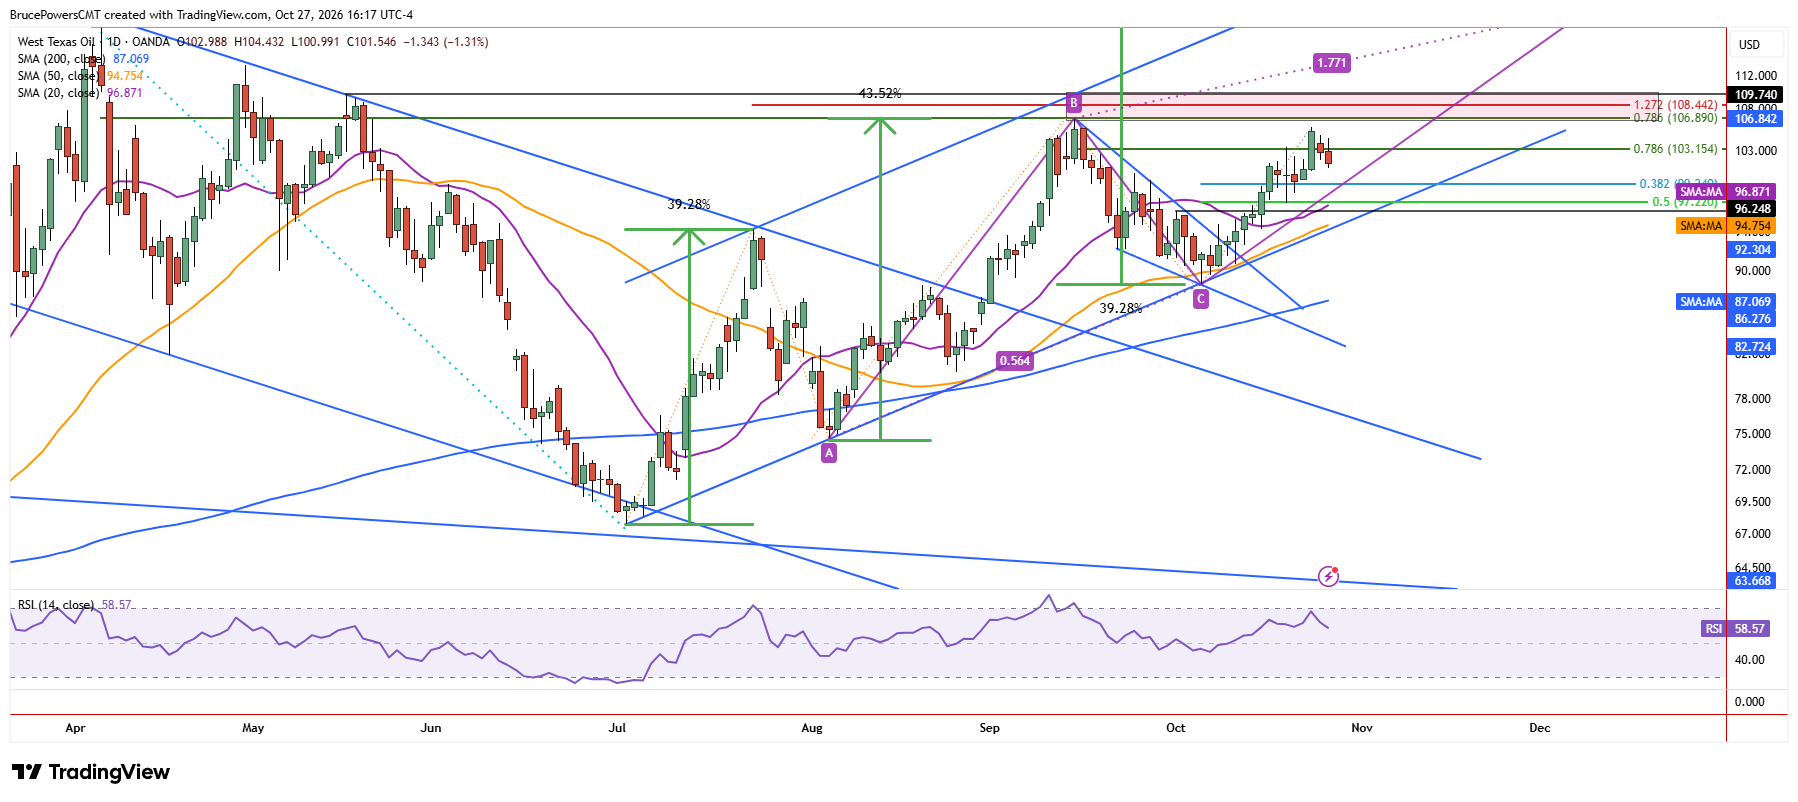
Fibonacci Support Levels Define the Pullback
On Tuesday, crude oil broke below Monday’s low of $101.32 to reach a new low of $100.99 at the time of writing, and sellers remained in control. There are several key support levels that could be tested, starting with the 38.2% Fibonacci retracement at $99.24. That would be a retracement of similar magnitude to the previous minor pullback.
For the weekly structure of higher highs and higher lows to remain intact, the price needs to hold above last week’s higher weekly low of $97.17, which aligns closely with the 50% retracement level at $97.22. Given the weekly structure and the larger developing bullish trend, the overall bullish outlook would remain intact as long as crude oil holds above that low.
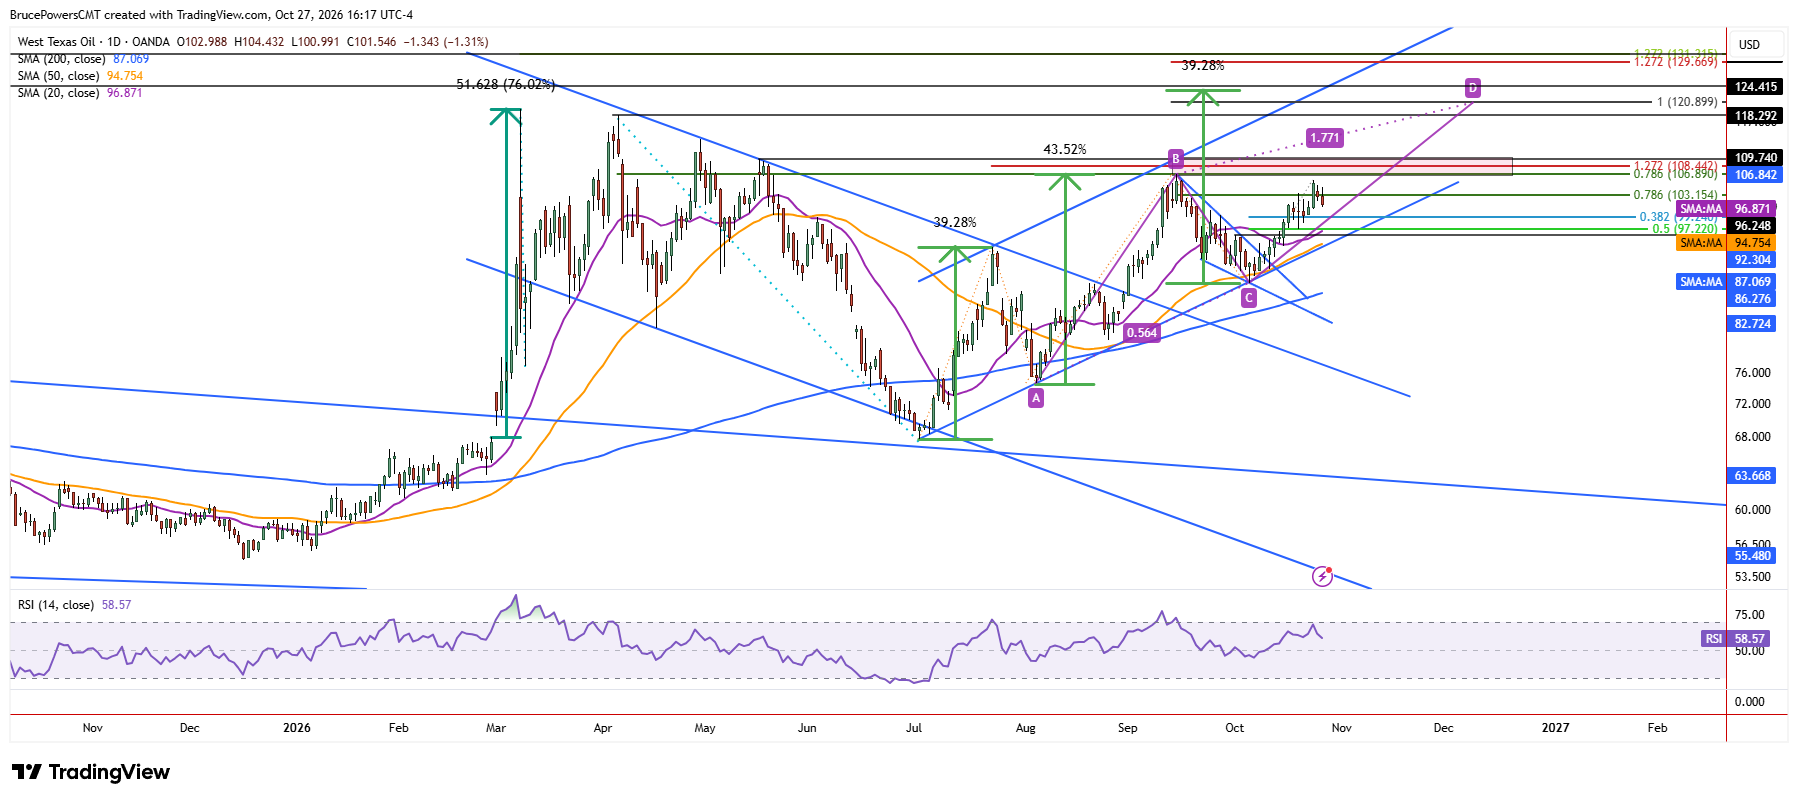
Rising 20-Day Average Offers Lower Support
The 20-day moving average, currently near $96.86 and rising, is a key short-term support indicator that could provide a lower potential target if the 38.2% retracement zone fails to hold as support. The moving average was reclaimed two weeks ago and there has not been a pullback to test it as support. Such a test would be healthy within the developing uptrend and could complete the short-term correction.
Higher Targets Remain in View
In the bigger picture, crude oil remains in a constructive bullish trend. The presence of two relatively symmetrical trend channels is one example of this. Therefore, the trend is anticipated to continue unless there is technical evidence to the contrary. The recent swing high of $106.84 marks the beginning of an initial resistance zone extending to approximately $109.74. If that level is breached decisively, there are several higher potential targets from $118.29 to around $123. A deeper pullback toward support would not necessarily undermine the bullish outlook, provided the key weekly low holds.
WTI Crude Oil Price Forecast
Every new WTI Crude Oil analysis as it publishes, today's technical signal and key levels, live price — on one page.
See all WTI Crude Oil forecastsIf you’d like to know more about how to trade crude oil, please visit our educational area.