


Failed Breakout Raises Double-Top Risk
WTI crude oil extended its pullback to a low of $94.62 on Tuesday further testing a key support zone first approached on Monday. Sellers took back control of crude oil on Friday, following a failed upside breakout from a bullish pennant pattern, which encountered strong resistance after reaching a new swing high of $106.45. The high successfully tested resistance near the prior high of $106.84 from September. It is now a lower swing high and a second top in a potential double-top formation.
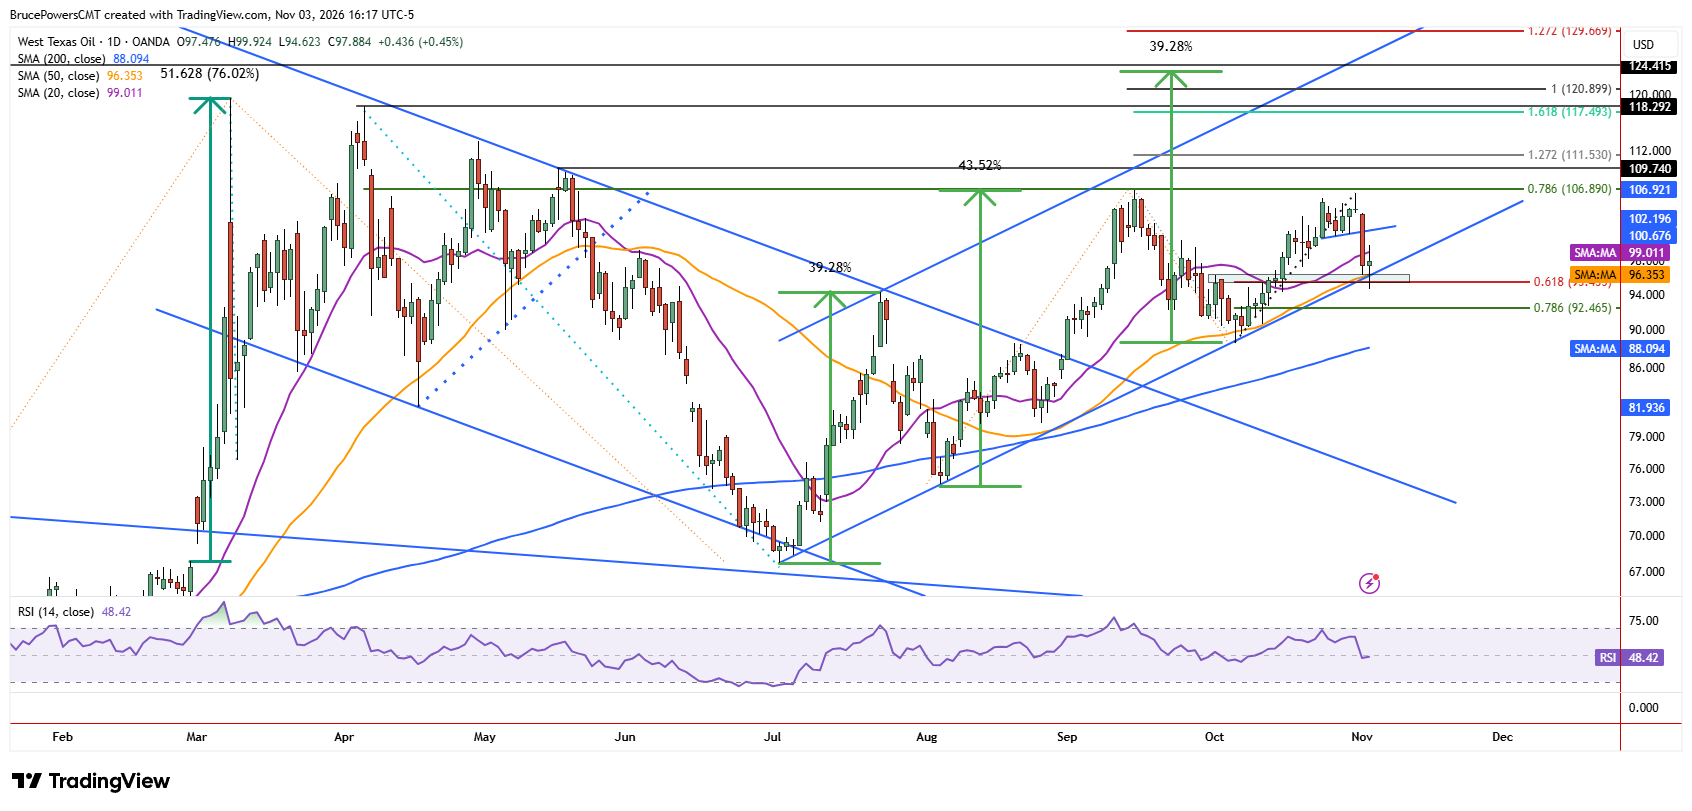
Key Fibonacci and Moving Average Support Under Pressure
Although Friday closed near support at the upper boundary of the pennant, the session ended with a bearish shooting star doji candlestick pattern. That pattern triggered on Monday, resulting in a sharp decline through the bottom of the consolidation range, as well as both the 10-day and 20-day moving averages, before reaching a three-week low of $96.26. That new low tested a key support confluence zone comprising the 50-day moving average, the lower boundary of a rising trend channel, and the 61.8% Fibonacci retracement of the prior upswing.
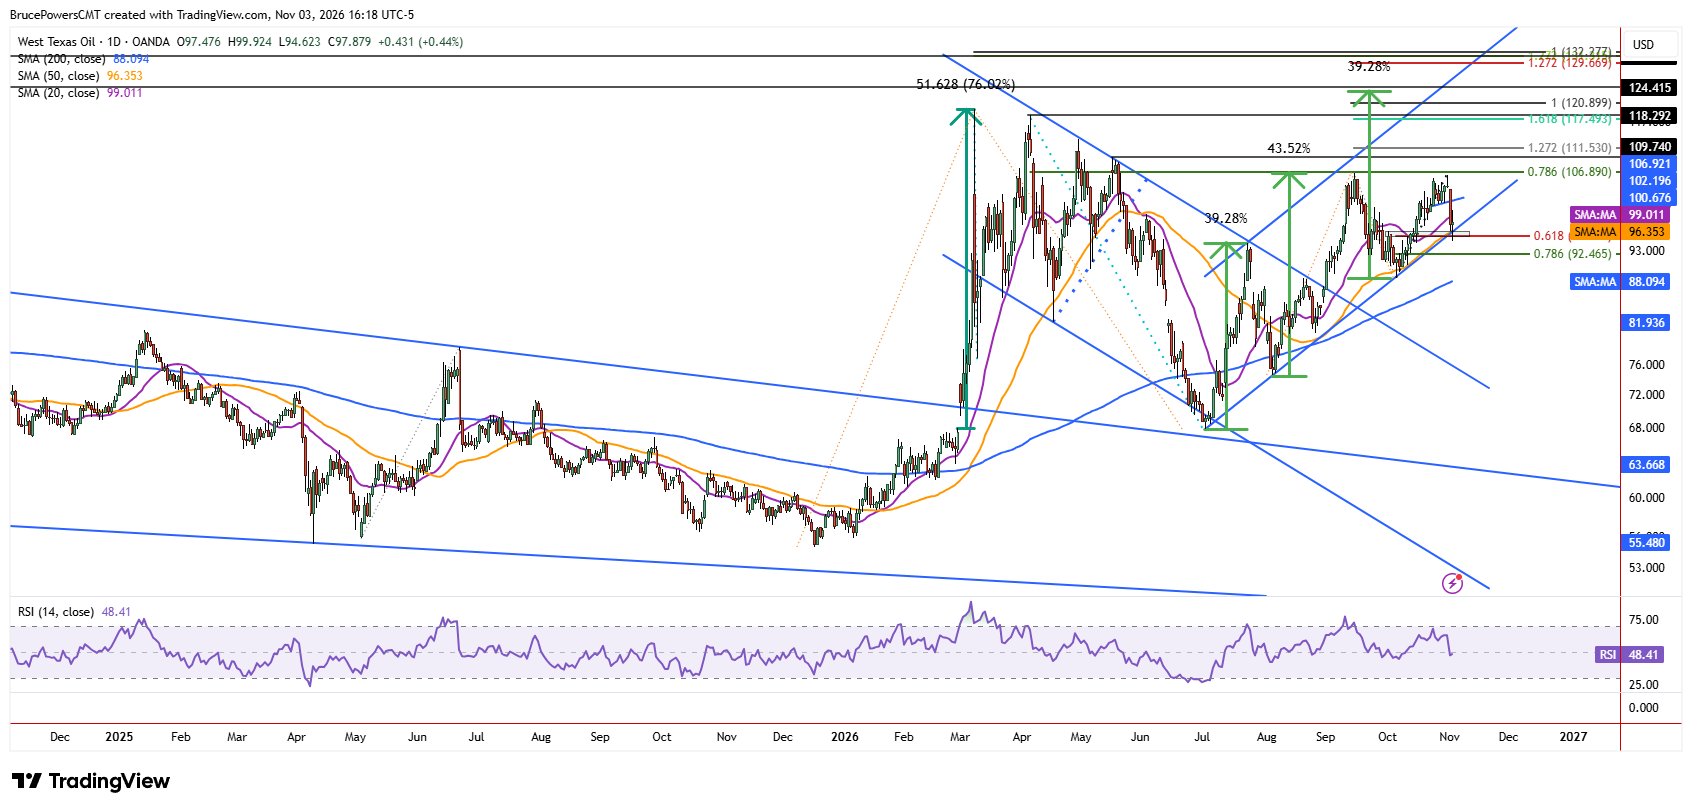
Buyers Fight Back at Critical Support
After reaching a new low of $94.62 on Tuesday, below the lower boundary of the support zone, buyers regained control and recovered key levels, particularly the 50-day moving average near $96.34. If crude oil closes the session above that level, it will have reclaimed the moving average and moved back above the key support zone, providing a short-term bullish sign. Sellers had a chance to drive prices lower, but have been unsuccessful so far, as buyers have recovered important technical levels.
Next Move Could Determine Larger Price Structure
Given the decisive selling that followed the new high, the price reaction around the current support zone over the coming days and weeks should provide important clues about the next directional move. If support at $94.62 continues to hold, this would be the fourth touch of the lower channel boundary, increasing its significance as a pivot zone.
While the sharp selling that followed a lower swing high reflects bearish price behavior and keeps the potential double top in play, if crude oil can maintain dynamic support above the rising 50-day moving average, it may yet make another attempt to break out above $106.84. Such a move would challenge the emerging bearish structure and potentially invalidate the double-top scenario.
WTI Crude Oil Price Forecast
Every new WTI Crude Oil analysis as it publishes, today's technical signal and key levels, live price — on one page.
See all WTI Crude Oil forecastsIf you’d like to know more about how to trade crude oil, please visit our educational area.