


Support Reclaimed, Buyers Regain Control
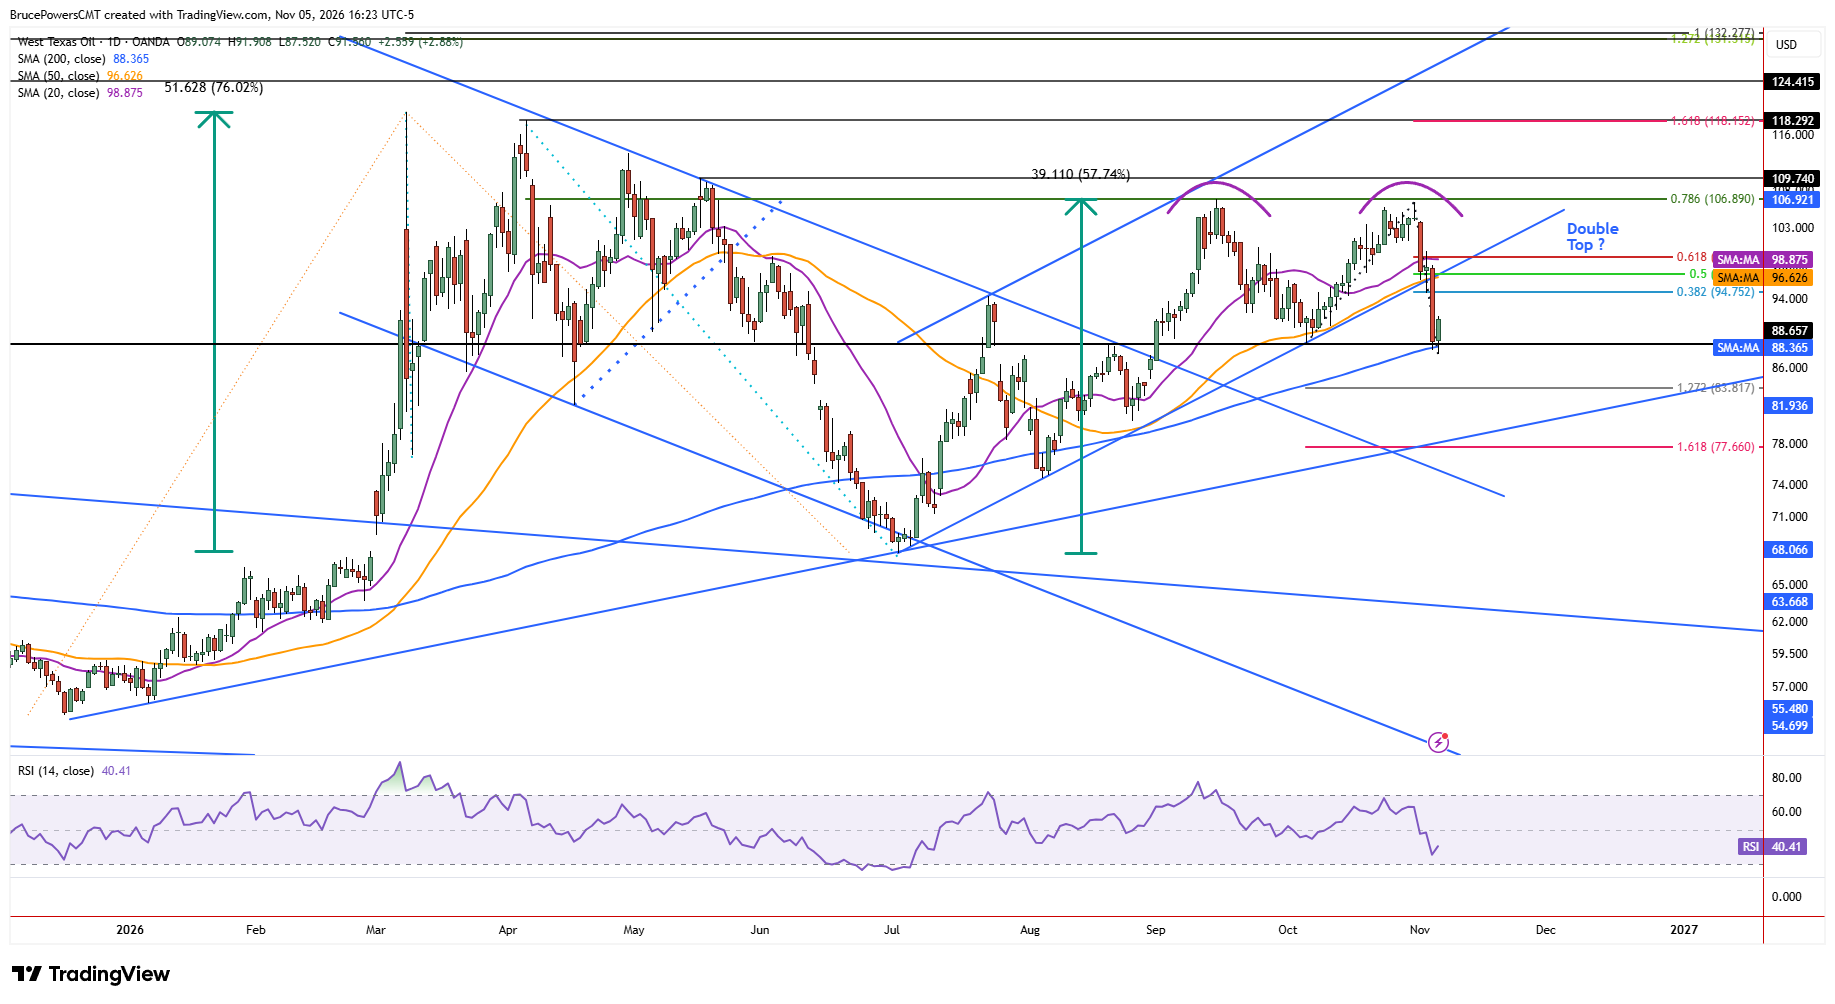
WTI crude oil found support near the 200-day moving average on Thursday, after reaching a marginally lower corrective low of $87.52 and bouncing. That resulted in a quick recovery of the 200-day moving average near $88.36 and a rally to a high of $91.67 for the session, at the time of writing. Buyers remain in control and trading continues near the high of the session and crude oil is on track to close the session in the top quarter of the session’s trading range.
Confluence Defines Critical Support Zone
Support was reinforced by a higher swing low from early October and a swing high from August. In addition, the magnitude of this decline matched that of the prior downswing, showing symmetry between the two declines and therefore a potential support level. The support range can be defined from $88.66 to $87.52 and derives from the prior swing low at $88.66 and Thursday’s low of $87.52. This is a key pivot zone that could result in further strength and a test of resistance near prior support levels, before another test of this week’s support zone and possibly a failure to hold it.
Rising Support Meets Developing Double Top
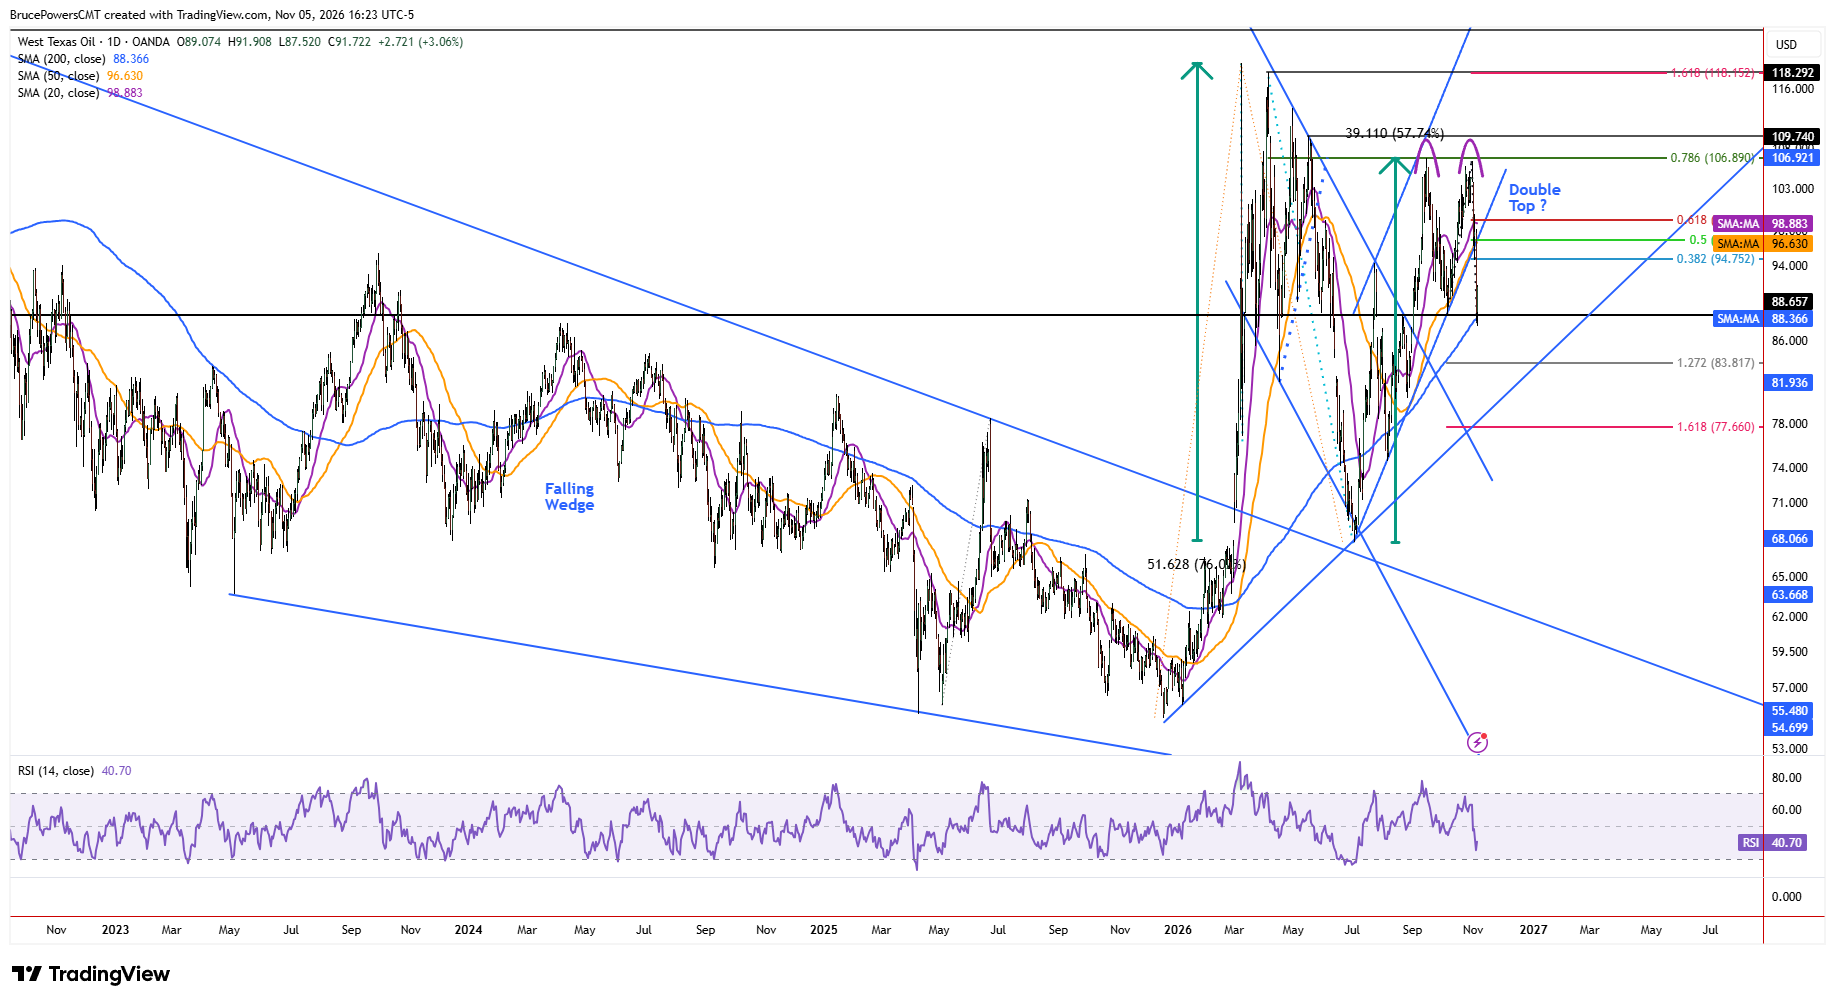
Since the 200-day moving average is rising, it will identify higher support levels if crude oil continues to rise. However, on Wednesday, a sharp breakdown below the rising channel and 50-day moving average occurred concurrently, showing a change in character. Bearish momentum followed last Friday’s high of $106.45, which was a test of resistance near the prior high of $106.84 from September, and produced a second potential peak for a double-top pattern. The neckline of the pattern is the $88.66 higher swing low, which also defines the rising trend structure from the July low.
Resistance Levels Frame Initial Recovery
Given the potential for support to hold above $87.52 in the short-term, the first pullback following the breakdown from the rising channel may follow. Possible resistance levels include Tuesday’s low of $94.62, reinforced by the 38.2% Fibonacci retracement at $94.75. Above that, resistance may emerge in the $96.25-$98.19 range, defined by Monday’s low and Wednesday’s high, followed by the 61.8% Fibonacci retracement of the prior decline at $99.22.
If you’d like to know more about how to trade crude oil, please visit our educational area.