


WTI Triangle Tightens Near Recent Highs
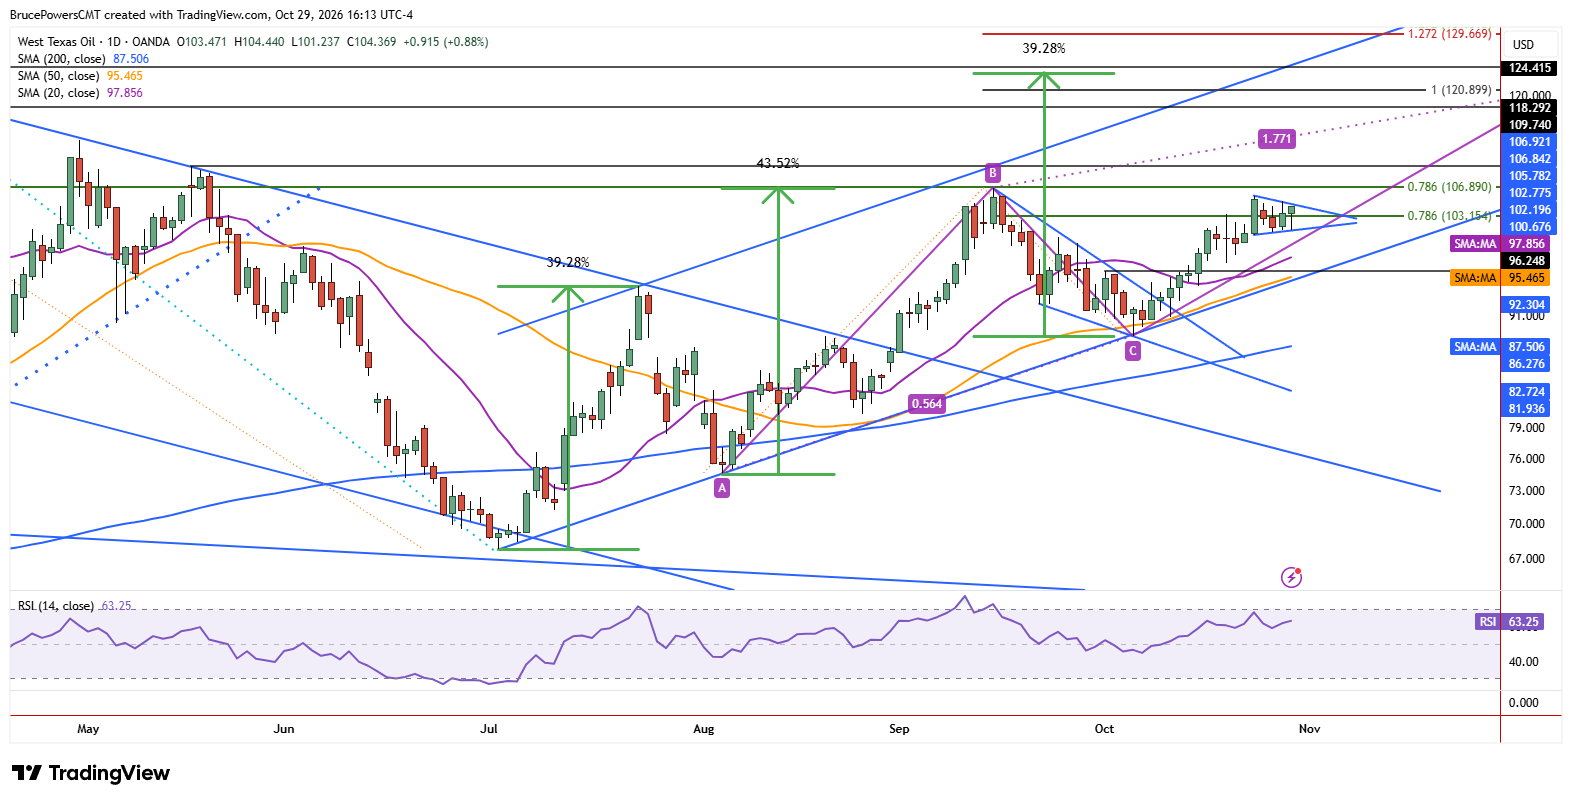
WTI crude oil consolidated for the fourth consecutive day on Thursday, with a small symmetrical triangle defining the immediate breakout and breakdown levels following last week’s new high of $105.78. This suggests buyers remain in control as the market digests recent gains after reaching that high. Although the consolidation pattern may be early in its formation, it adds to the significance of resistance at Friday’s high of $105.78 and support at $100.68. Notably, Friday’s advance to a new high also triggered a breakout from a small symmetrical triangle that had formed over just three days.
Breakout Faces Resistance Through $109.74
An initial bullish breakout signal would occur above Wednesday’s high of $105.09, with a second signal above $105.78. That would indicate a continuation of the advance, although the move would soon encounter a potential resistance zone extending from the recent high of $106.84 to the May swing high of $109.74. An attempt to break above that zone may be difficult without a longer correction than is currently indicated by the triangle boundaries.
Higher Price Targets Emerge Above $119.54
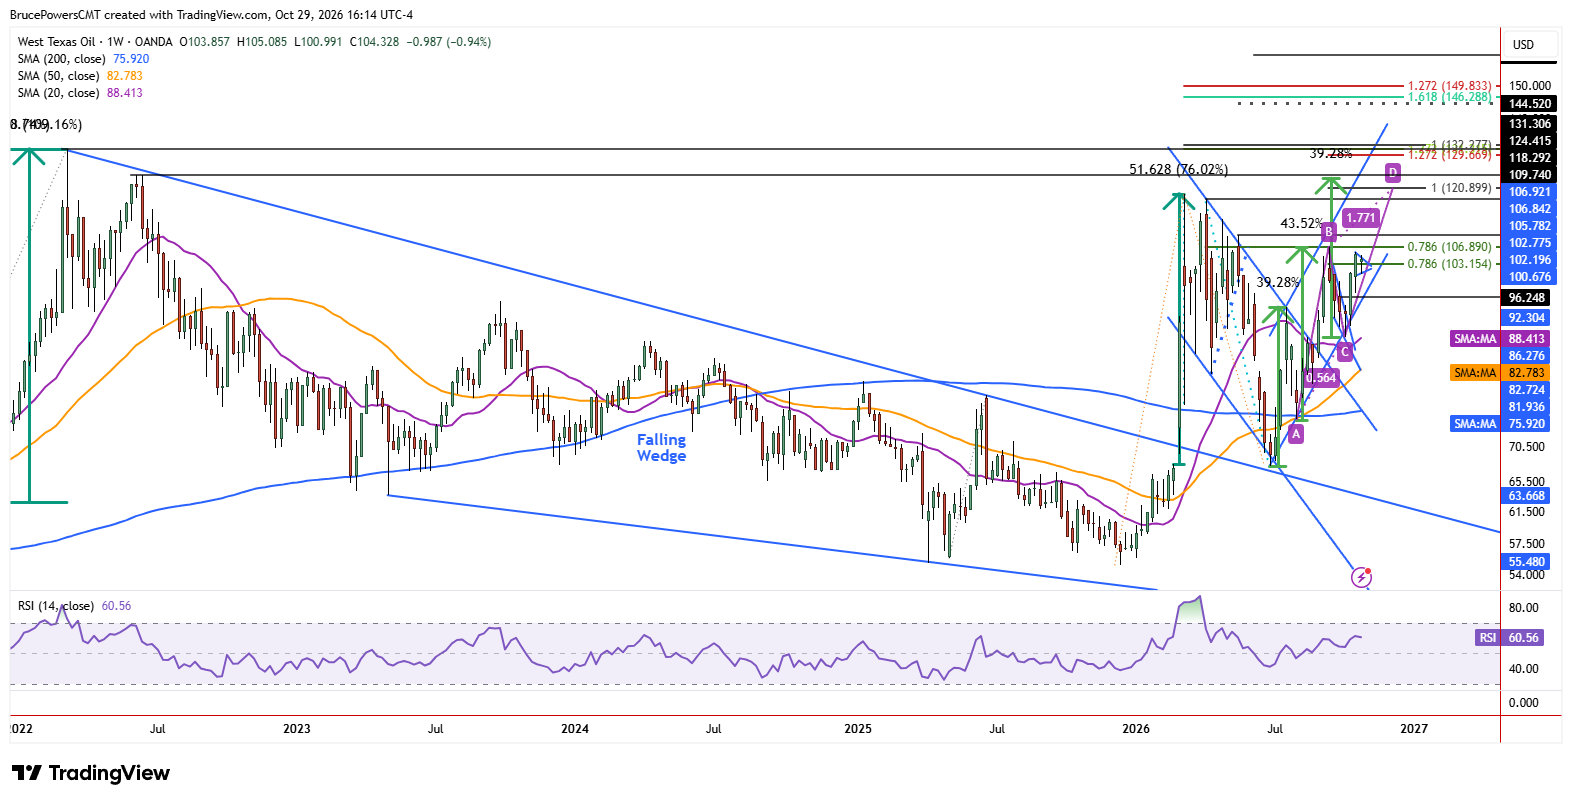
Nonetheless, if crude oil can sustain a recovery above $109.74, the prospects of eventually testing the recent highs ranging from $113.43 to $119.54 would improve. Possible resistance targets above $119.54 include the 100% projection of a rising ABCD pattern at $120.90. Price symmetry between the two advances could attract resistance near this level. A measured-move target near $123 is reinforced by a lower swing high from May 2022 at $124.42, highlighting a potential resistance zone between $123 and $124.42.
Breakdown Risks a Test of 20-Day Support
Alternatively, a break below Tuesday’s low of $100.99 would signal initial weakness, while a subsequent break below Friday’s low of $100.68 would strengthen the short-term bearish case. That would put the 20-day moving average, now near $97.78, in focus as the first downside target. The average has not yet been tested as support during a pullback since it was reclaimed in mid-October. As the average continues to rise, the potential downside target may also move higher, depending on when the triangle breaks down.
If you’d like to know more about how to trade crude oil, please visit our educational area.