


WTI Crude
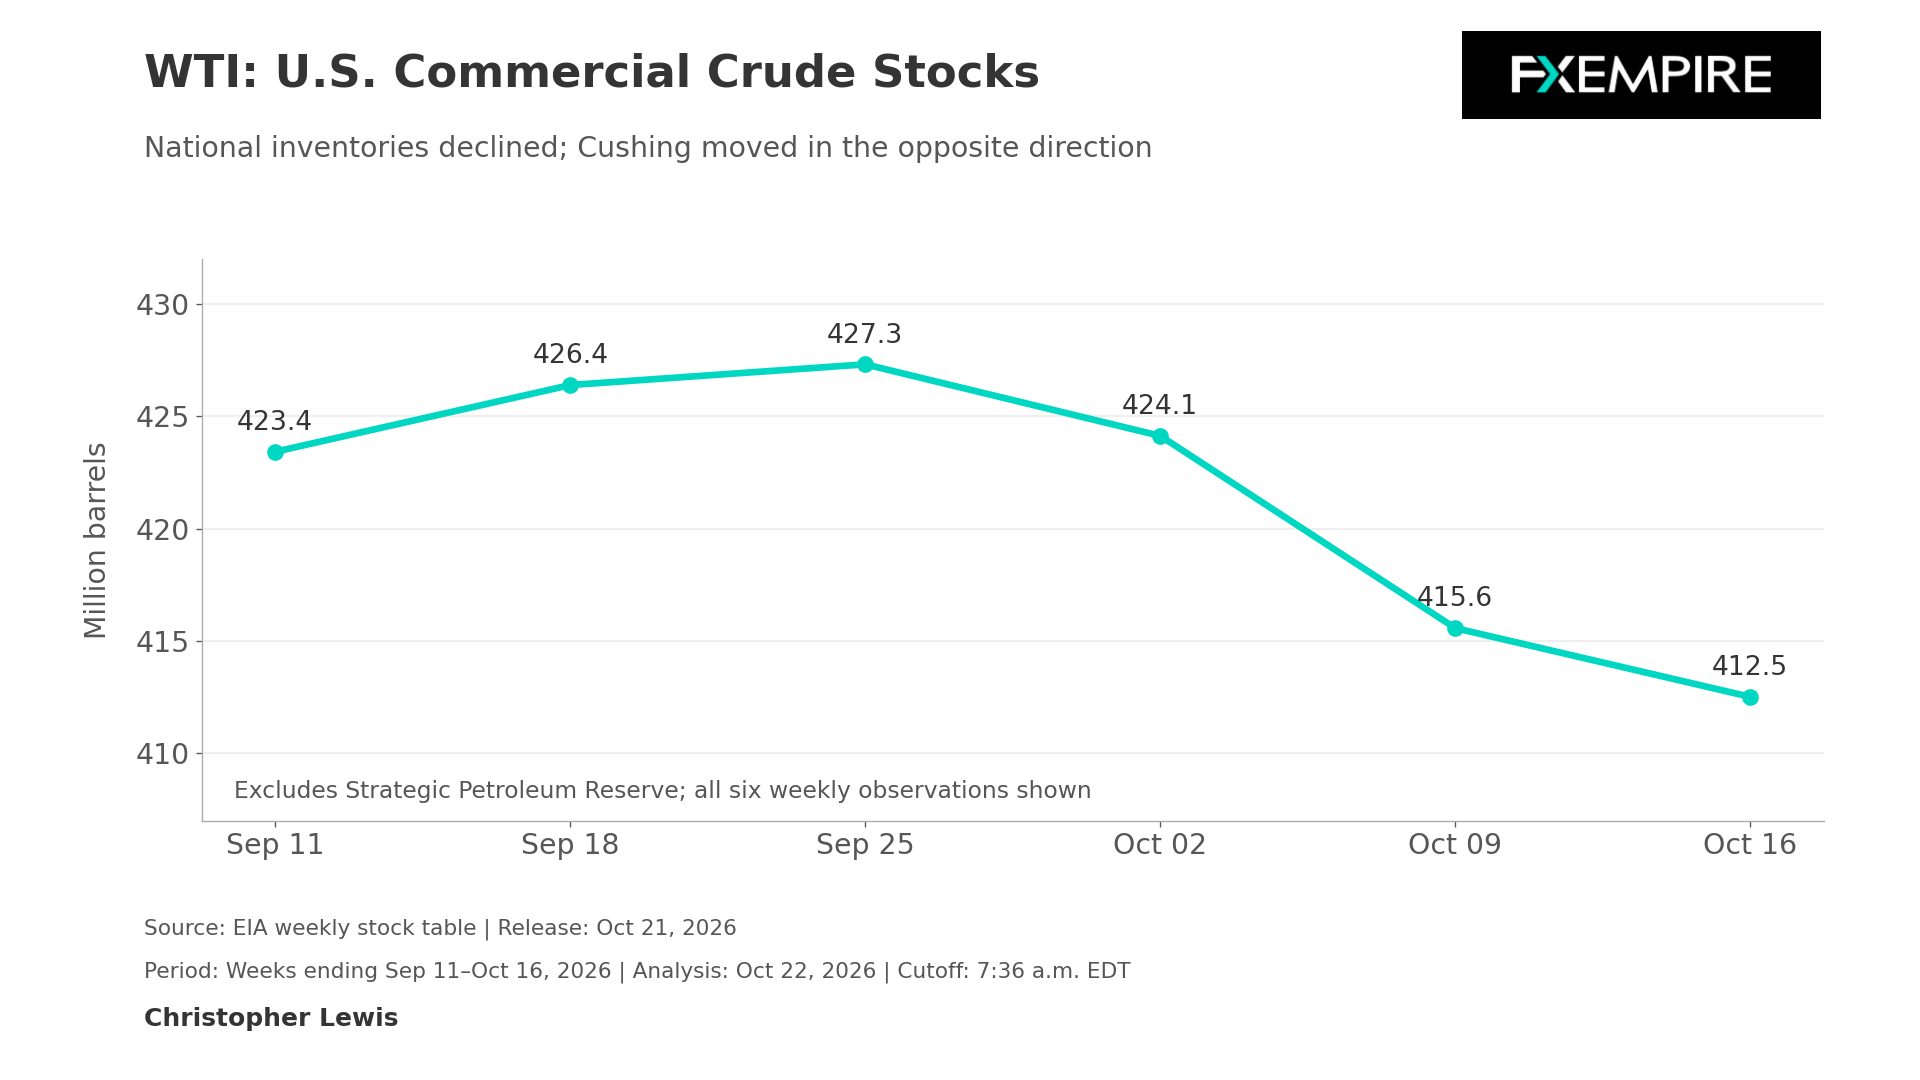
WTI centers on whether the U.S. crude draw reflects significant and lasting tightness or a temporary reduction in supply. The inventory release published yesterday, covering the week ending October 16, saw commercial crude stocks fall to 412.517 million barrels from 415.57 million, while Cushing inventories rose to 27.594 million barrels from the previous reading of 26.607 million. The national balance tightened a bit, but delivery cushions have increased.
Market Balance
The weekly balance also showed estimated domestic production falling by 410,000 barrels per day to 13.269 million. Lower production can help explain a draw without demonstrating stronger final consumption. The next important test will be whether inventories continue to decline when supply recovers.
Temporary supply reduction and sustained demand improvement have different implications for tightness in the market. Imports also fell by 291,000 barrels per day to about 5.8 million. Refineries processed roughly 16.6 million barrels per day at 93.4% utilization. Gasoline inventories fell by 3 million barrels, while distillate stocks increased by 1.7 million. This product mix argues against describing every part of the petroleum system as tightening uniformly.
Gasoline
Four-week gasoline stock product supplied was 1.5% above a year earlier, but distillate product supply was 2.4% lower. Continuing commercial draws, resilient refinery demand, and an eventual reduction in available supply would be the bullish scenario for WTI. The next EIA weekly petroleum stock update is listed for October 28, so traders will be looking ahead to that.
Trading the market
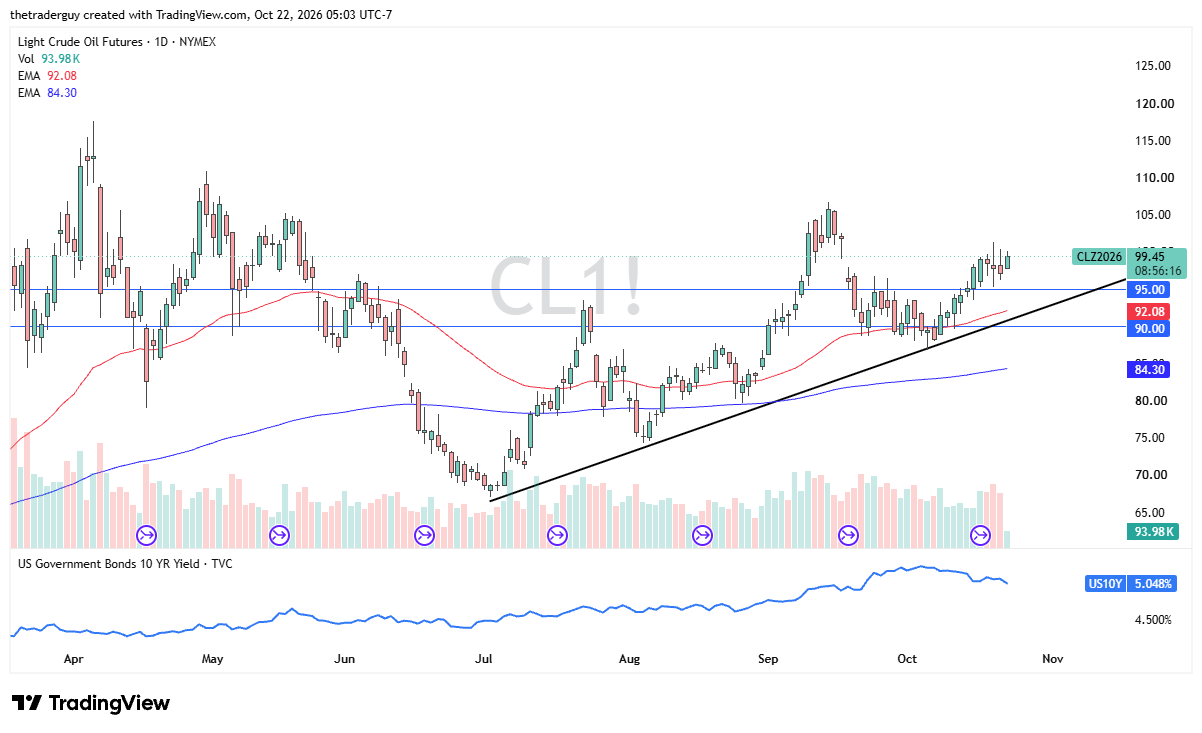
From a technical standpoint, we have seen WTI rise slightly during the trading session as we continue to threaten the $100-per-barrel level. The United States pulling diplomats out of Saudi Arabia, in what seems to be a sign that more attacks on Iran are coming, could come to fruition as a bullish catalyst as well. This remains a buy-the-dip market.
Brent Oil Price Forecast
Every new Brent Oil analysis as it publishes, today's technical signal and key levels, live price — on one page.
See all Brent Oil forecastsBrent Crude
Brent markets also have seen plenty of moving pieces, with yesterday’s U.S. Treasury October 21 sanctions action against Iranian shipping facilitators. Treasury designated Panama- and Greece-based law firms and shipping agents based in Singapore and the UAE as blocked property. This was an announced action yesterday as part of the expanding sanctions.
There is a distinction between enforcement and physical supply. Treasury’s release documents legal restrictions, not measured reductions in exports. The action could complicate some shipping, counterparties, and compliance decisions, but this does not necessarily add to the number of lost barrels. For Brent, the question will be whether there are fewer completed deliveries, longer voyages, or more expensive access to transport. If alternative services and routes absorb the disruption, the supply effect would be limited.
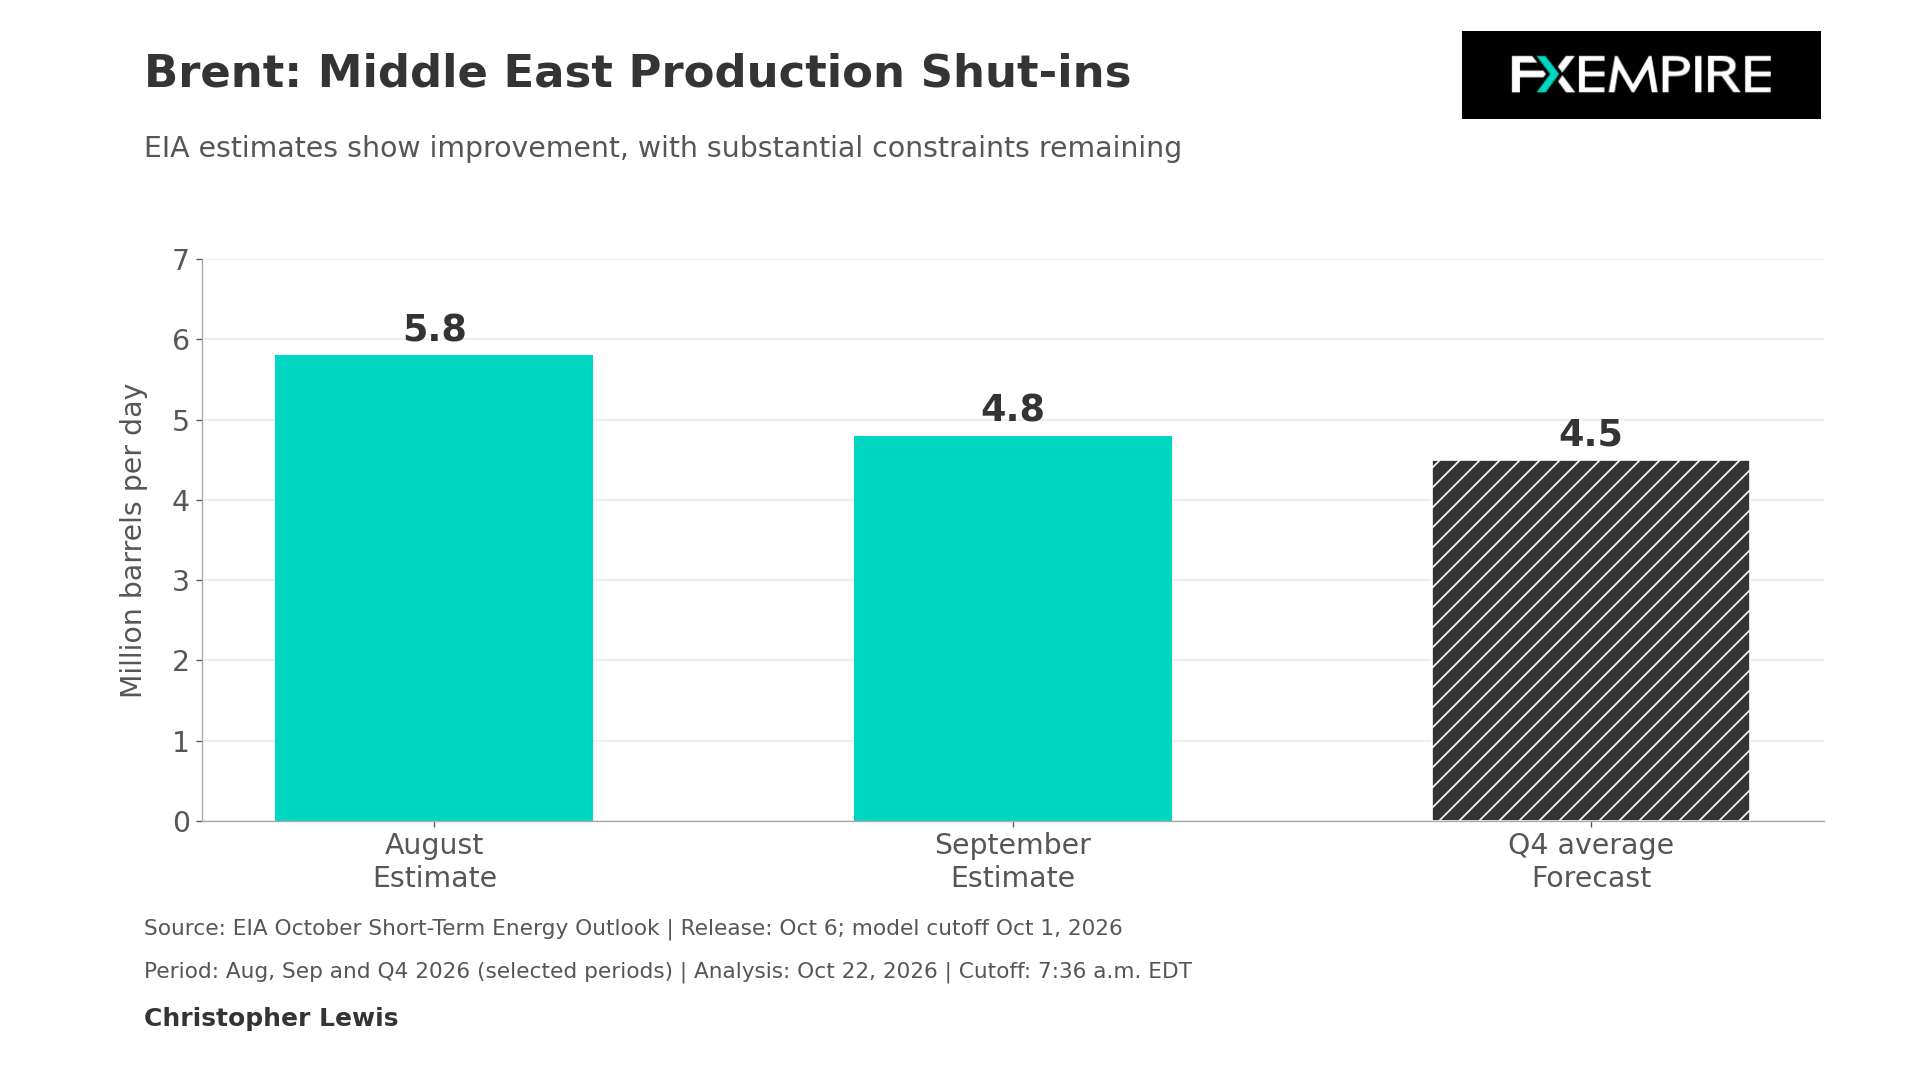
The accompanying chart shows the EIA October 6 outlook, completed on October 1, estimating Middle Eastern production shut-ins at 5.8 million barrels per day in August and 4.8 million in September, with a fourth-quarter forecast of 4.5 million. U.S. inventory tightening persists as production changes, and questions about shipping restrictions can affect international delivered supplies. WTI’s national stock draw does not necessarily resolve Brent’s transport risk.
Trading Brent
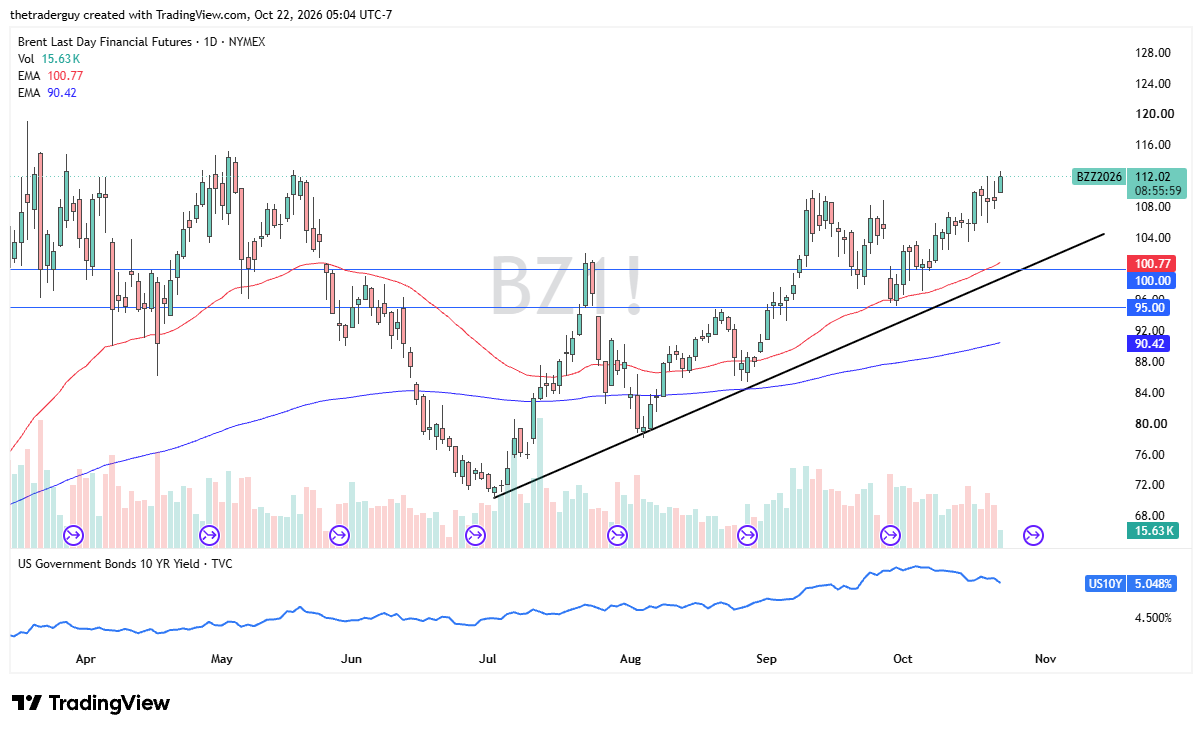
Furthermore, with the United States pulling ambassadors out of Saudi Arabia, this could show that Brent will find itself in the direct line of conflict again. At this point, from a technical standpoint, it looks like the market is trying to break out to the upside, so any dips will be thought of as value. A clearance of the $115 level could get the Brent market screaming to the upside.