


XLE Technical Analysis
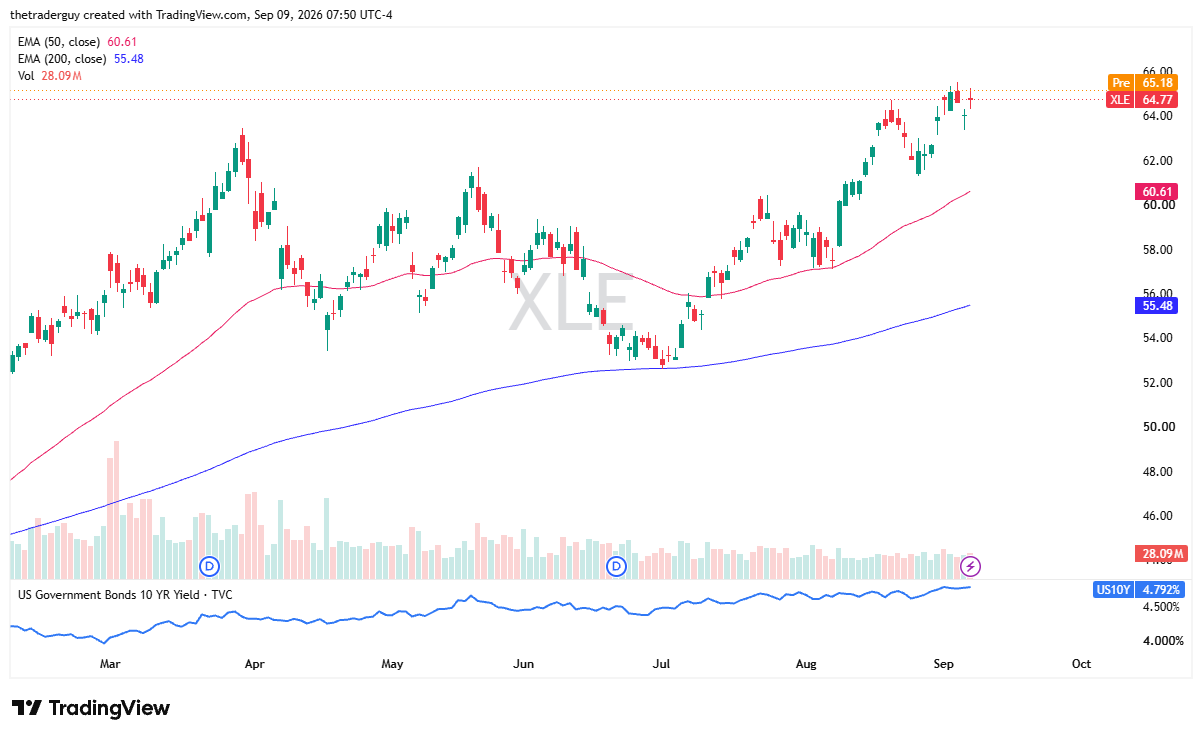
The XLE ETF is where I start. This is the energy sector and, no surprise, it is seeing a little bit of upward pressure in pre-market trading as the United States and Iran continue to attack each other in minor tit-for-tat blows in the Strait of Hormuz. This is driving the price of oil higher, and it, of course, has a major influence on where the XLE moves.
At this point, it looks as if the market is trying to break out into a fresh new high. Short-term pullbacks continue to get bought into over the last couple of weeks and, in this environment with oil supply being threatened, it makes a certain amount of sense that the market is bullish.
XLF Technical Analysis
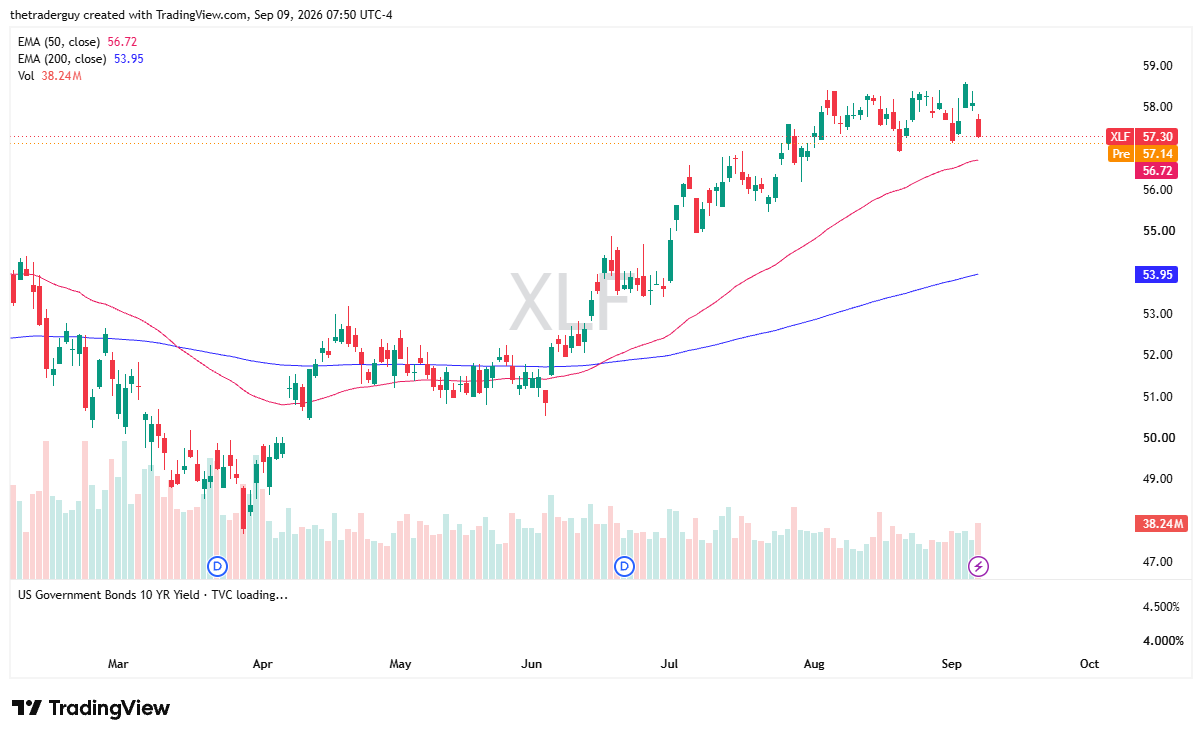
XLF, which is the financials, is a little bit soft in pre-market trading, but I would point out that we’ve been consolidating for a couple of weeks. Short-term range-bound traders may find this an intriguing setup. Something along the lines of a sideways trading system that perhaps takes advantage of stochastic oscillators or other types of range-bound indicators may find this an interesting place to do a little trading.
The 50-day EMA sits right at $56.72, so it’s just below current action, with the $57 region offering support going back through the entire month of August.
XLV Technical Analysis
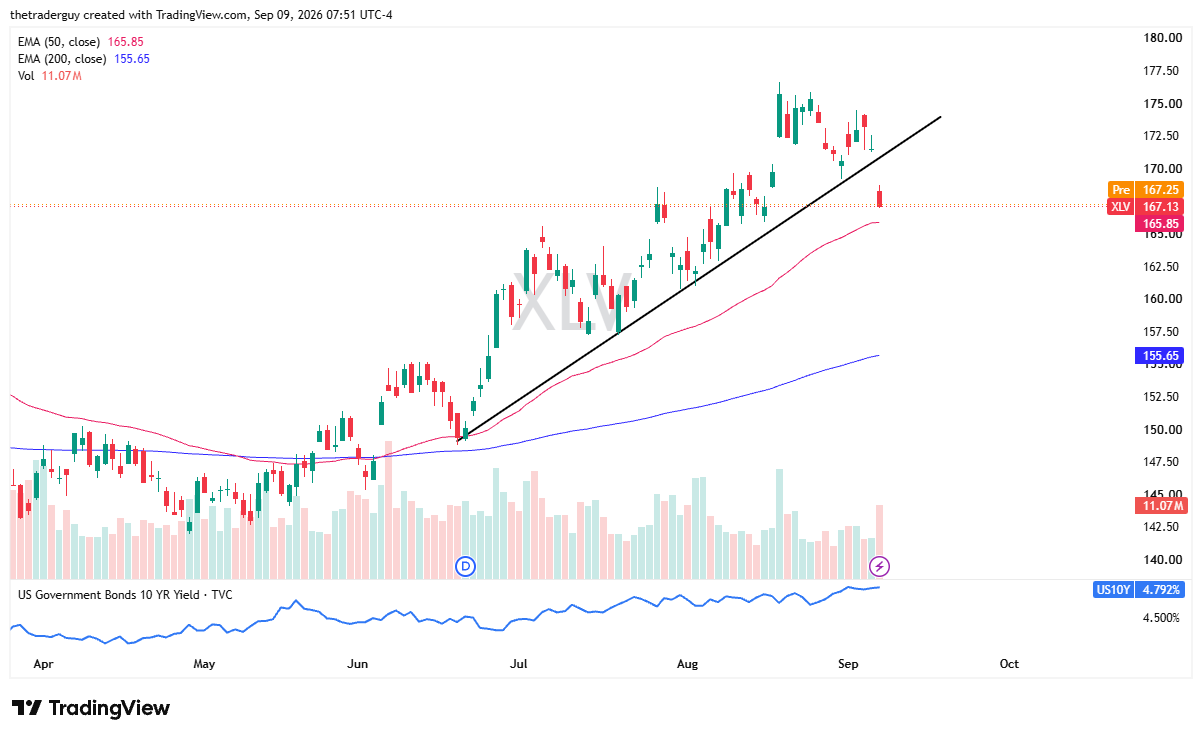
And finally, the XLV, or healthcare sector, is pretty much flat at the beginning of the session, but the market gapped lower during Tuesday trading and now is trying to come to terms with the 50-day EMA underneath, offering support. It also gapped through a pretty significant trend line going back to the third week of June.
So the question is, will this continue to go lower? This is one that I watch a lot, mainly because of the risk appetite ramifications of healthcare stocks. It’s not that I’m a big healthcare stock investor; it’s that they tend to do well when there’s a lot of fear out there.
If you’d like to know more about technical analysis and how traders use it, please visit our educational area.