


XLV (Healthcare) Technical Analysis
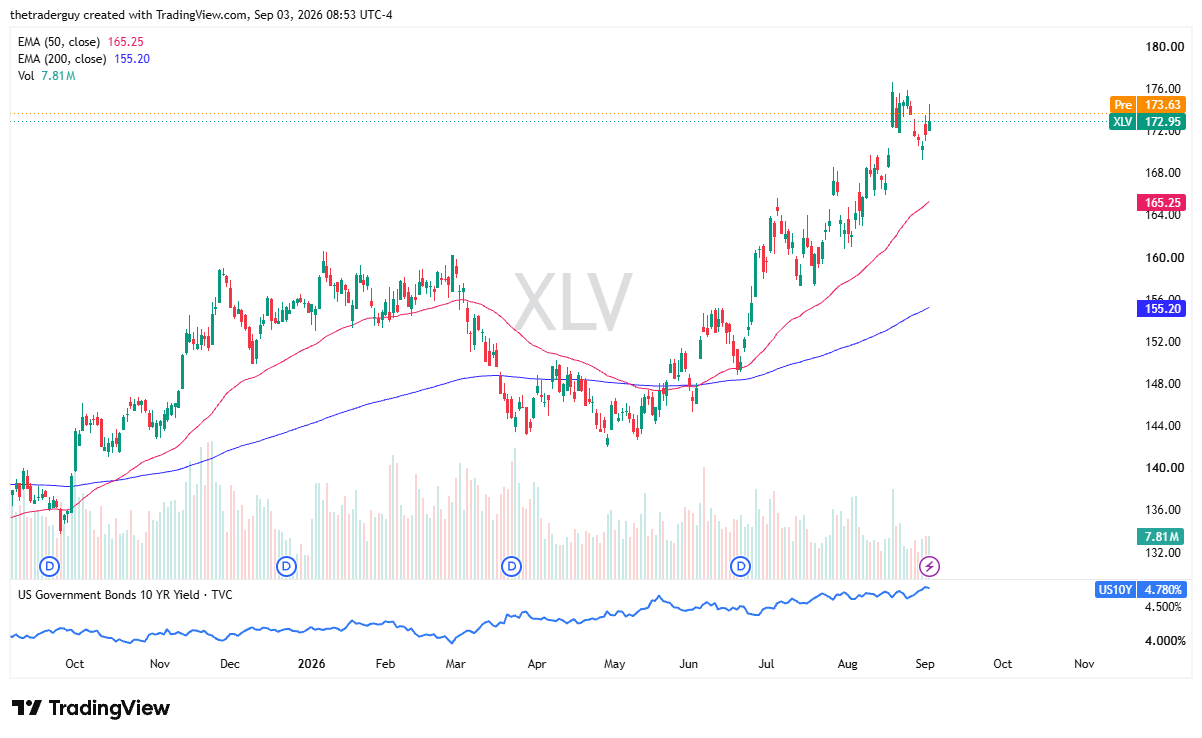
The XLV, or Healthcare Sector ETF, is looking somewhat positive in premarket trading, which makes sense. It’s a little bit of a defensive play in the United States, and it’s been a nice uptrend for some time. Using this ETF is something that I do from time to time when the market seems a little erratic and uncertain, and that has certainly been the case as of late. If we look at the S&P 500, you can see how sideways and noisy it’s been, but at the same time, healthcare continues to chug right along. Looks like it’s going to open up pretty positive.
XLK (Technology) Technical Analysis
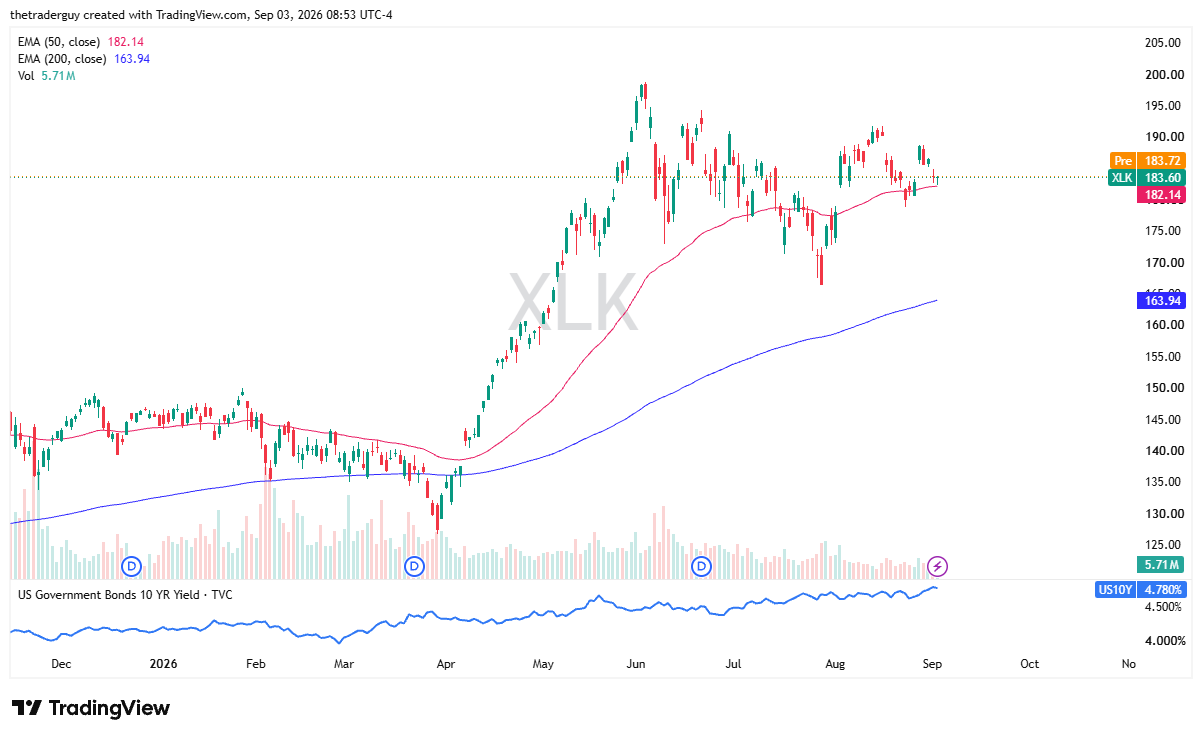
The XLK, or Technology ETF, is something I’m watching as well. We are sitting right at the 50-day EMA. Looks like we’re going to open up basically where we left off on Wednesday for the Thursday session. The 50-day EMA could offer a bit of support. We have been consolidating between $190 and $182 over the last couple of weeks.
Looks like we’re basically just hanging around in this area. I think a little bit of volatility and a little bit of noise is to be expected, but at the end of the day, that’s technology in a nutshell. Interest rates are a little high, but it has been fighting back. This is a good way in my account to trade technology on the whole without getting overexposed to any one particular stock. With the AI trade being a little bit noisy as of late, I have found this to be a little bit easier to hang onto.
MOO (Agriculture) Technical Analysis
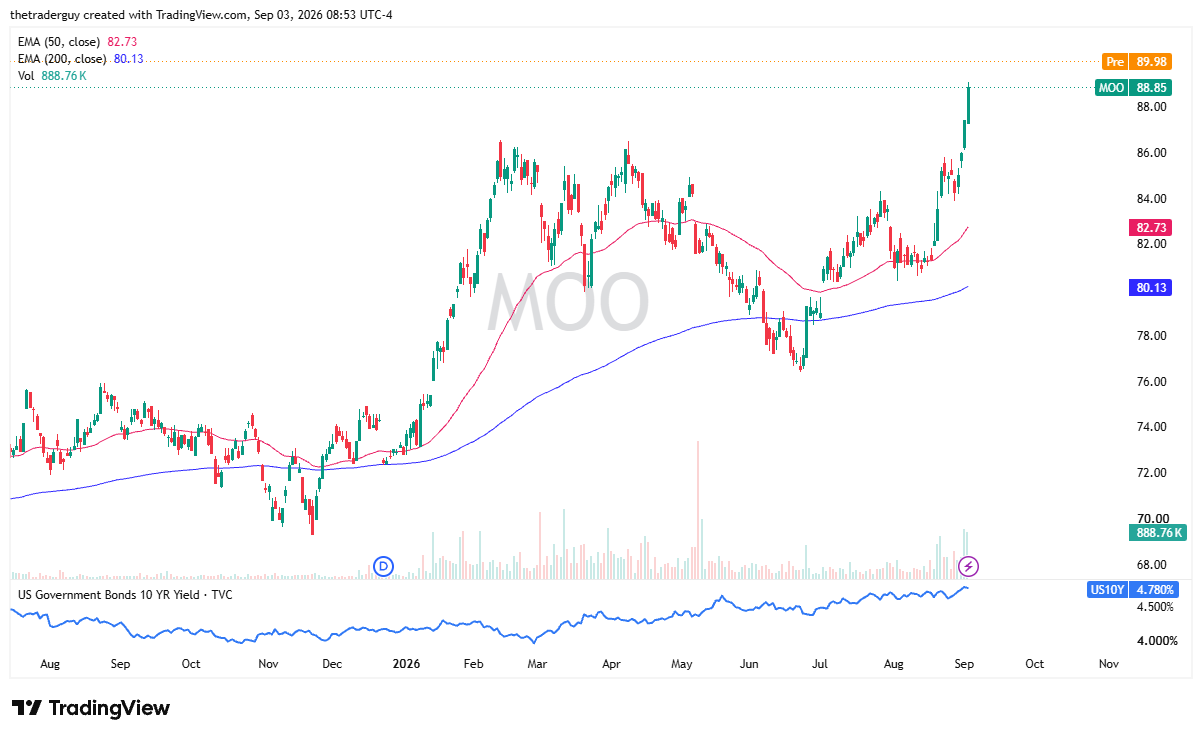
The last ETF I’m looking at is MOO. This is an agricultural ETF, and it looks like it’s going to open up quite strong. It’s been strong for several days, and that makes sense.
All one has to do is look at wheat, corn, soybeans; they all look the same. This also gives us exposure to companies like John Deere, Archer-Daniels-Midland, those types of companies that aren’t necessarily a play on futures, but a play on the agricultural space in general. This looks really healthy to me. We’ve recently broken out, and it looks like we’ve got real momentum here. I’m very bullish of MOO.
If you’d like to know more about technical analysis and how traders use it, please visit our educational area.