XRP was back in the red today. However, the SEC will release unredacted versions of the Hinman doc that could blow the SEC v Ripple case wide open.
On Monday, XRP gained 0.83%. Following a 2.73% rise on Sunday, XRP ended the day at $0.52527. Despite the bullish session, XRP fell short of the $0.53 handle for the second time in four sessions.
A bearish start to the day saw XRP fall to an early morning low of $0.50903. Steering clear of the First Major Support Level (S1) at $0.5063, XRP rose to a late session high of $0.52795. However, falling short of the First Major Resistance Level (R1) at $0.5324, XRP eased back to end the day at $0.52527.
It was a quiet session Monday. There were no updates from the ongoing SEC v Ripple case to draw interest. The lack of SEC v Ripple news left XRP in the hands of the broader crypto market.
US lawmaker chatter continued to hit the news, with Republican lawmakers targeting the SEC Chair. However, Republican-backed legislation would need the support of both sides of the aisle, which could prove challenging considering the White House’s stance on cryptos.
While US lawmakers offered support, the William Hinman speech-related documents remain the focal point. Today, the SEC will release the heavily anticipated Hinman speech-related documents. The speech-related documents continue to fuel optimism for a Ripple win in the long-lasting battle with the SEC.
A Ripple victory would be a boon for XRP and the broader crypto market.
Ripple CEO Brad Garlinghouse had this to say about the Hinman docs,
“Wish I could go in depth now, but we’ve waited this long (18+ months), I don’t want to overstep… suffice to say Stuart Alderoty and I believe they were well worth the wait.”
It is a busy Tuesday session, with the US CPI Report and the Fed in the spotlight. While hotter-than-expected inflation numbers would fuel bets on a more hawkish Fed, investors will remain focused on the Hinman docs.
We expect US lawmakers and the crypto market to respond to the content, which could force lawmakers to consider an alternative solution to the SEC regulating the digital asset space.
SEC v Ripple case updates and SEC v Binance, and SEC-Coinbase (COIN)-related news would also move the dial.
At the time of writing, XRP was down 0.34% to $0.52347. A mixed start to the day saw XRP rise to a high of $0.52689 before falling to an early low of $0.51943.
Resistance & Support Levels
| R1 – $ | 0.5325 | S1 – $ | 0.5136 |
| R2 – $ | 0.5397 | S2 – $ | 0.5018 |
| R3 – $ | 0.5586 | S3 – $ | 0.4829 |
XRP needs to avoid the $0.5208 pivot to target the First Major Resistance Level (R1) at $0.5325. A move through the Monday high of $0.52913 would signal an extended breakout session. However, SEC v Ripple chatter and the crypto news wires must support a breakout session.
In the case of an extended rally, XRP would likely test the Second Major Resistance Level (R2) at $0.5397 and resistance at $0.55. The Third Major Resistance Level (R3) sits at $0.5586.
A fall through the pivot would bring the First Major Support Level (S1) at $0.5136 into play. However, barring another risk-off-fueled sell-off, XRP should avoid sub-$0.50. The Second Major Support Level (S2) at $0.5018 should limit the downside. The Third Major Support Level (S3) sits at $0.4829.
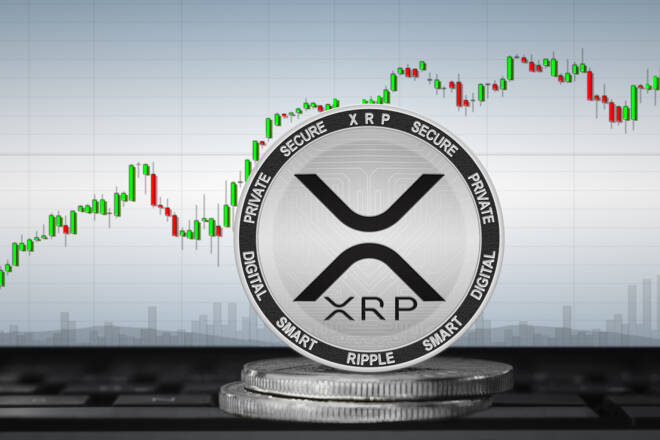
The EMAs and the 4-hourly candlestick chart (below) sent bullish signals.
At the time of writing, XRP sat above the 50-day EMA, currently at $0.51555. The 50-day EMA pulled away from the 100-day EMA, with the 100-day EMA widening from the 200-day EMA. The EMAs delivered bullish signals.
A hold above the 50-day EMA ($0.51555) would support a breakout from R1 ($0.5325) to target R2 ($0.5397) and $0.55. However, a fall through the 50-day ($0.51555) would bring S1 ($0.5136) and the 100-day EMA ($0.50715) into view. A fall through the 50-day EMA would send a bearish signal.
With over 28 years of experience in the financial industry, Bob has worked with various global rating agencies and multinational banks. Currently he is covering currencies, commodities, alternative asset classes and global equities, focusing mostly on European and Asian markets.