Support and resistance are key components to any trading strategy. Once you determine that a financial security is a robust candidate to catch a specific
Support and resistance are key components to any trading strategy. Once you determine that a financial security is a robust candidate to catch a specific move, finding the correct entry and exit levels are key to long term success. Which risk management is the most important equation in creating a successful trading strategy, the entry level usually gets most investors attention.
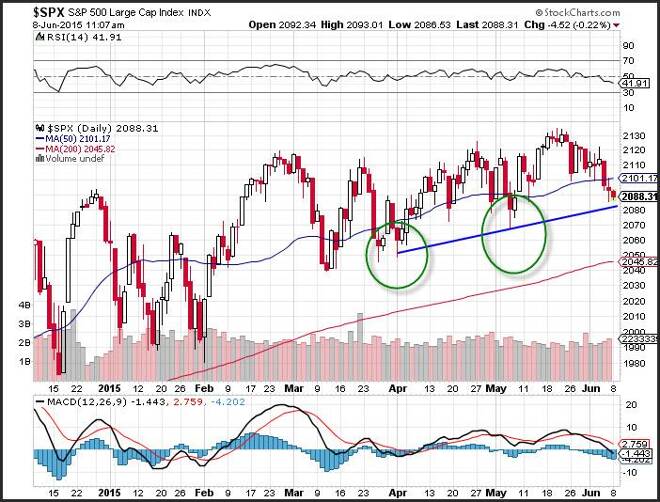
Trend lines are often used to determine of a market is breaking out. A trend line is either support or resistance and usually connects 2 or more points, and a close above (or below) the slope of the trend line usually signals a breakout (or breakdown).
The most difficult part of finding this type of breakout is creating an objective trend line. There are many questions investors have with regard to this subject. For example, should a trend line be based on a close only chart of an open high low close chart? Should you use the closing point to determine the breakout or breakdown or is an intra-day breach satisfactory?
One of the best technical analysis studies on trend lines is Tom DeMarks trend line analysis. DeMark created the TD (Tom DeMark) trend lines which help chartists formulate objective trend lines that follow specific rules each time they are used.
The DeMark trend line is upward sloping for trend line that create support and downward sloping for trend line that generate resistance. Many times analysts will created trend lines that alter these rules, for examples when a channel is created resistance might be upward sloping, but in DeMarks world this rule is hard fast.
TD Trend Lines
The TD trend line only uses the open high low close chart (or a Candle chart). The line only chart does not enough information for the TD line to be pertinent. This is because DeMark believe that the pivot high point reflects the most important resistance area while the pivot low point reflects the most important support level.
The basic TD trend line connects the most recent low that is surrounded by a higher low on each to the next lower low that is also surrounded by a higher low on each side. These two lines are connected and the slope of the trend line hits a point that is your new support level. A stronger level of support that can be used as a breakdown level connects a low which has two higher lows on each side to the next lower low with two lows on each side.
The most robust TD trend line connects a low surrounded by three higher lows on each side to the next lower low surrounded by three higher lows. The slope of this trend line is the most significant. When the price of a security closed below the TD trend line a breakdown has occurred.
The same technique is used to create TD resistance lines and they have the same premise with a basic TD and then more robust TD lines.
Trend line development is an important concept that should be used to determine where a trader should enter the market. Using TD lines is an objective way to consistently enter trades in an objective manner.
David Becker focuses his attention on various consulting and portfolio management activities at Fortuity LLC, where he currently provides oversight for a multimillion-dollar portfolio consisting of commodities, debt, equities, real estate, and more.