
Advertisement
Advertisement
30-Yr U.S. Treasury Bonds (US) Futures Technical Analysis – August 12, 2015 Forecast
By:
September 30-Year U.S. Treasury Bonds surged during the pre-market session after the People’s Bank of China devalued the Yuan a second straight day. The
September 30-Year U.S. Treasury Bonds surged during the pre-market session after the People’s Bank of China devalued the Yuan a second straight day.
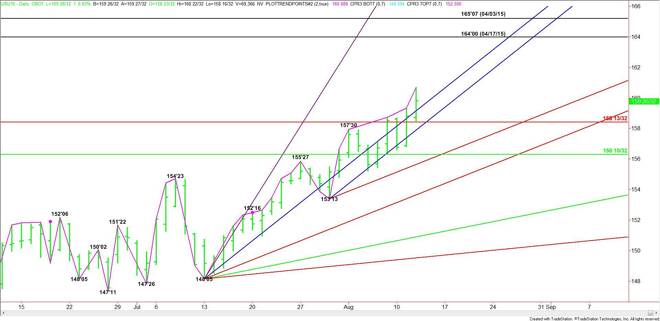
The main trend is up according to the daily swing chart. The strong rally has also put T-Bonds on the strong side of a steep uptrending angle at 159’05. A trade back below this level will not mean that the trend is getting ready to change back to down, but it will indicate that the upside momentum is slowing.
A sustained move under the 159’05 could trigger a break back into the major Fibonacci level at 158’13. This is followed by another steep uptrending angle at 157’29.
The daily chart opens up to the downside under 157’29 with the next major target a major 50% level at 156’10. This is followed by another uptrending angle at 155’21.
There is enough upside momentum during the pre-market session to give T-Bonds an early upside bias today. The direction of the market during the regular session is likely to be determined by trader reaction to the pre-market high at 160’22.
Traders are going to take out 160’22 with conviction and sustain the move, or enough selling pressure may come in to produce a potentially bearish closing price reversal top. The daily chart indicates there is plenty of room to the upside on a sustained move over 160’22. It may take several days to reach them, but the primary upside targets are the April 17 main top at 164’00 and the April 3 main top at 165’05.
Watch the price action and read the order flow if 160’22 is tested during the regular session. Trader reaction to this price will determine whether the bulls or the bears are in control.
About the Author
James Hyerczykauthor
James Hyerczyk is a U.S. based seasoned technical analyst and educator with over 40 years of experience in market analysis and trading, specializing in chart patterns and price movement. He is the author of two books on technical analysis and has a background in both futures and stock markets.


Advertisement