September 30-Year U.S. Treasury Bonds finished lower on Wednesday. The move could’ve been triggered by position-squaring ahead of Friday’s U.S. Non-Farm
September 30-Year U.S. Treasury Bonds finished lower on Wednesday. The move could’ve been triggered by position-squaring ahead of Friday’s U.S. Non-Farm Payrolls report, or it could’ve been fueled by aggressive shorting in anticipation of a bullish report and a possible rate hike by the Fed in September.
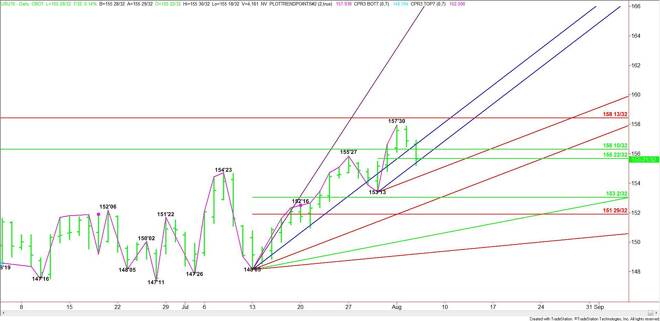
Technically, the main trend is up according to the daily swing chart, but momentum is pointing lower.
Earlier in the week, T-Bonds ran into resistance at 157’30. This high fell inside a major retracement zone at 156’10 to 158’13.
The short-term range is 153’13 to 157’30. Its 50% level or pivot at 155’22 is controlling the short-term direction of the market.
Crossing to the weak side of the pivot at 155’22 will signal the presence of sellers. This could trigger a break into the next uptrending angle at 154’21. This is followed by the main bottom at 153’13. A trade through this bottom will change the main trend to down.
The main range is 148’05 to 157’30. Its retracement zone is 153’02 to 151’29. A trade through 153’13 will likely trigger a move into this retracement zone. An uptrending angle passes through this zone at 152’21, making it a valid downside target also.
A sustained move over the pivot at 155’22 will indicate the presence of buyers. Recapturing the uptrending angle at 155’29 will indicate that the buying is getting stronger. The next pivot price over 155’29 is the major 50% level at 156’10. Overtaking this level with conviction targets another steep uptrending angle at 157’05.
A sustained move over 157’05 could create enough upside momentum to test the minor top at 157’30 and the major Fibonacci level at 158’13.
The trigger point for a strong surge to the upside is 158’13.
Based on the close at 155’21, the direction of the market today will be determined by trader reaction to the short-term pivot at 155’22.
Start watching for signs of increased volatility and read the price action and order flow at 155’22.
James Hyerczyk is a U.S. based seasoned technical analyst and educator with over 40 years of experience in market analysis and trading, specializing in chart patterns and price movement. He is the author of two books on technical analysis and has a background in both futures and stock markets.