
Advertisement
Advertisement
30-Yr U.S. Treasury Bonds (US) Futures Technical Analysis – August 7, 2015 Forecast
By:
September 30-Year U.S. Treasury Bonds are trading flat shortly ahead of the regular session opening and the release of the latest U.S. Non-Farm Payrolls
September 30-Year U.S. Treasury Bonds are trading flat shortly ahead of the regular session opening and the release of the latest U.S. Non-Farm Payrolls figures. The jobs report is expected to show the economy added 222K new jobs in July.
The report is important because it will help the Fed time its first interest rate hike since 2006. A number substantially above 222K will likely mean the Fed will raise rates in September. This could trigger a sharp break. A number substantially below 222K will likely mean the Fed will wait until December before raising rates. This could trigger a resumption of the uptrend.
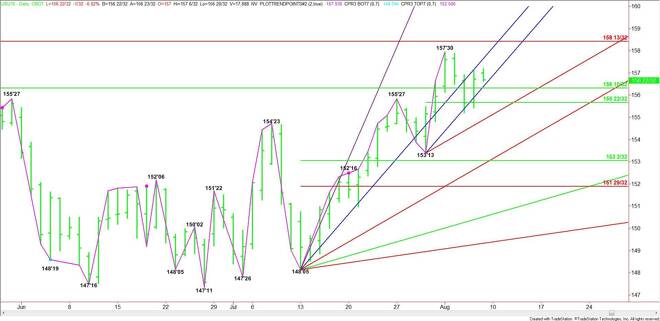
Today’s regular session is likely to begin with T-Bonds trading slightly above a steep uptrending angle at 156’13 and a major 50% level at 156’10. A sustained move over this area will signal the presence of buyers. This could trigger a rally into the steep uptrending angle at 157’21.
Look for increased upside momentum on a sustained move over 157’21 with a minor top at 157’30 the next target, followed by a major Fibonacci level at 158’13. The Fib level is also a potential trigger point for a surge into 160’00.
A failure to hold 156’10 will signal the presence of sellers. This could trigger a break into the short-term pivot at 155’22. The daily chart opens up under this level with the uptrending angle at 154’29 the next target.
The angle at 154’29 is also a potential trigger point for an acceleration to the downside with the next targets a main bottom at 153’13 and an uptrending angle at 152’29. A trade through 153’13 will turn the main trend to down on the daily chart.
The primary downside target of a steep sell-off today is a 50% level at 153’02.
Based on the current price at 156’22, the direction of the market today will be determined by trader reaction to the major 50% level at 156’10.
Be prepared for the increased volatility with the release of the jobs data at 8:30 a.m. ET.
About the Author
James Hyerczykauthor
James Hyerczyk is a U.S. based seasoned technical analyst and educator with over 40 years of experience in market analysis and trading, specializing in chart patterns and price movement. He is the author of two books on technical analysis and has a background in both futures and stock markets.


Advertisement