BTC in Limbo Amid Mixed Fed Rate Cut Signals
On Sunday (June 16), bitcoin (BTC) gained 0.56%. Following a 0.20% gain on Saturday (June 15), BTC ended the week down 4.40% at $66,614. Significantly, BTC fell short of the $67,000 handle for the second time since May 16.
Uncertainty about a September Fed rate cut continued influencing buyer demand for BTC.
Recent US inflation and consumer sentiment figures raised investor bets on a September Fed rate cut. According to the CME FedWatch Tool, the chances of the Fed standing pat in September tumbled from 49.5% to 29.8% in the week ending June 14.
However, the market outlook was more dovish than the FOMC Economic Projections. The Fed raised its Fed Funds Rate projection to 5.1% and its core PCE inflation forecast to 2.6% for 2024. An FFR projection of 5.1% reduces 2024 Fed rate cuts from three to one.
While the Nasdaq Composite Index advanced by 3.24% in the week ending June 14, the US BTC-spot ETF market saw total weekly net outflows of $580.6 million. Notably, the US BTC-spot ETF market ended a five-week net inflow streak, while the Nasdaq Composite Index had a five-day winning streak.
“We will ensure that the future of crypto and the future of bitcoin will be made in America. We’re going to keep it right here, and a lot of it’s going to be done right here in Florida.”
The Republican Party front-runner has targeted the 50 million plus Americans holding crypto. A Republican Party victory in the US Presidential Election would end the SEC reign of regulation through enforcement and likely introduce a more crypto-friendly SEC Chair.
A crypto-friendly regulatory framework that protects retail investors could lure more investors into the crypto space.
While BTC remains the crypto market barometer, ETH-spot ETF-related chatter warrants investor attention.
On Saturday (June 15), ETF Store President Nate Geraci had this to say about an ETH-spot ETF market,
Bitcoin Price Forecast
Every new Bitcoin analysis as it publishes, today's technical signal and key levels, live price — on one page.
See all Bitcoin forecasts“And once again, for the record, I think people are underestimating potential eth ETF demand….”
Technical Analysis
Bitcoin Analysis
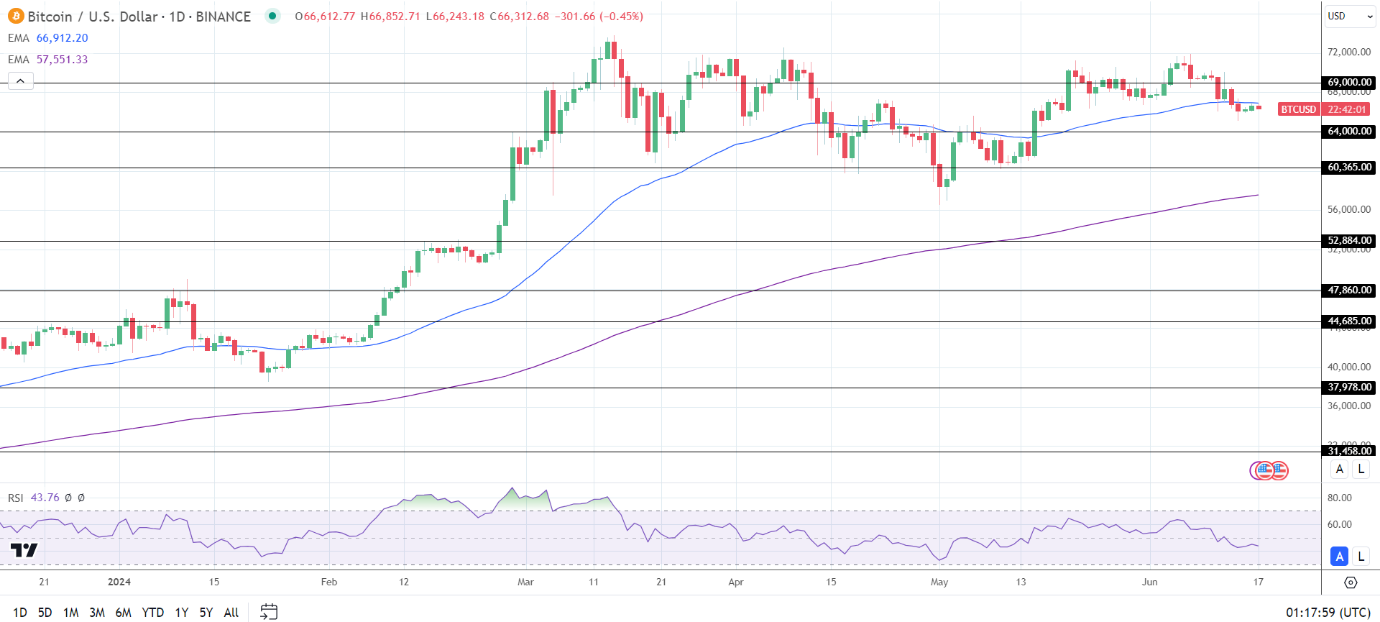
BTC hovered below the 50-day EMA while remaining above the 200-day EMA, affirming the bearish near-term but bullish longer-term price signals.
A BTC breakout from the 50-day EMA could signal a move to the $69,000 resistance level. A break above the $69,000 resistance level could give the bulls a run at the $73,808 all-time high.
SEC activity, FOMC Member chatter, and sentiment toward the Fed rate path require consideration.
Conversely, a BTC break below $65,000 could give the bears a run at the $64,000 support level.
With a 43.76 14-Daily RSI reading, BTC could fall through the $64,000 support level before entering oversold territory.
Ethereum Analysis
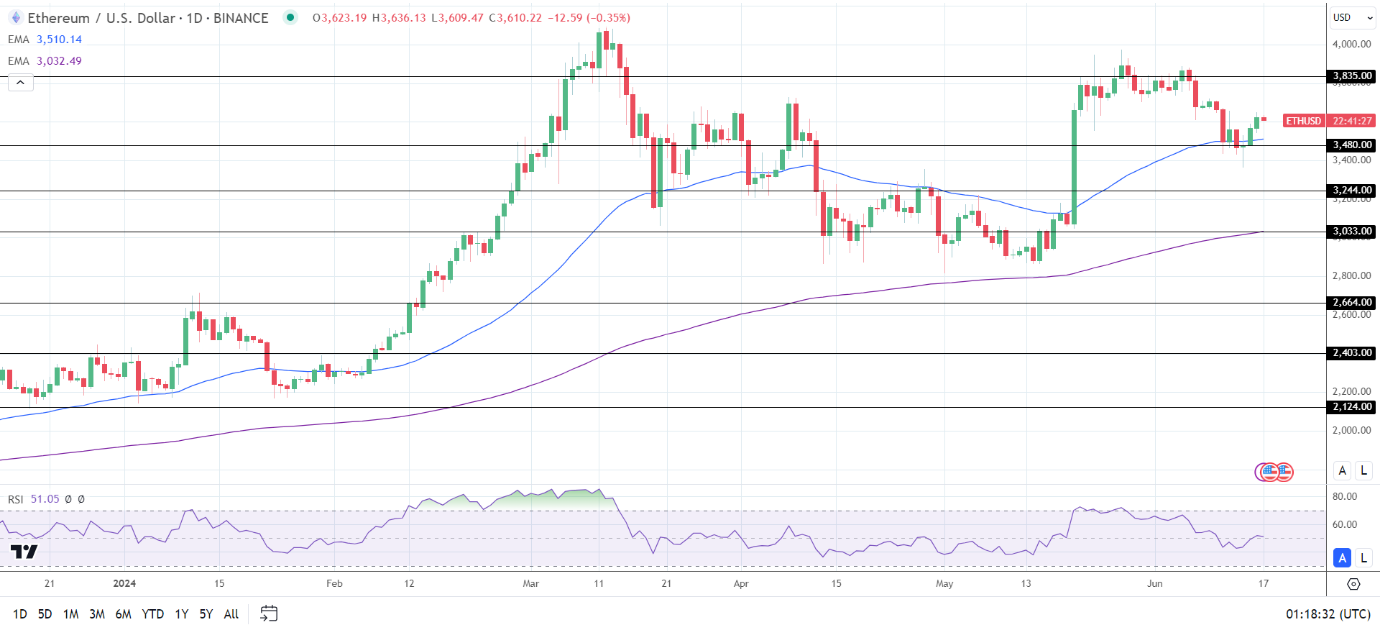
ETH remained above the 50-day and 200-day EMAs, affirming the bullish price signals.
An ETH break above the $3,750 handle could give the bulls a run at the $3,835 resistance level.
US ETH-spot ETF-related updates also need consideration.
Conversely, an ETH fall through the 50-day EMA and the $3,480 support level would bring the $3,244 support level into play.
The 14-period Daily RSI reading, 51.05, indicates an ETH break above the $3,835 resistance level before entering overbought territory.