


Bitcoin (BTC) is testing its most important long-term support level, and a clean breakdown could turn the current selloff into a much deeper crash.
Bitcoin Tests Its 200-Week SMA “Panic Line”
Bitcoin has dropped toward the $62,000 area, falling more than 15% in a single weekly candle and landing directly on its 200-week simple moving average (blue) near $61,800.
The 200-week SMA has historically served as Bitcoin’s bear-market panic line, the zone where heavy selling starts to slow, long-term buyers step in, and major cycle bottoms begin to form.
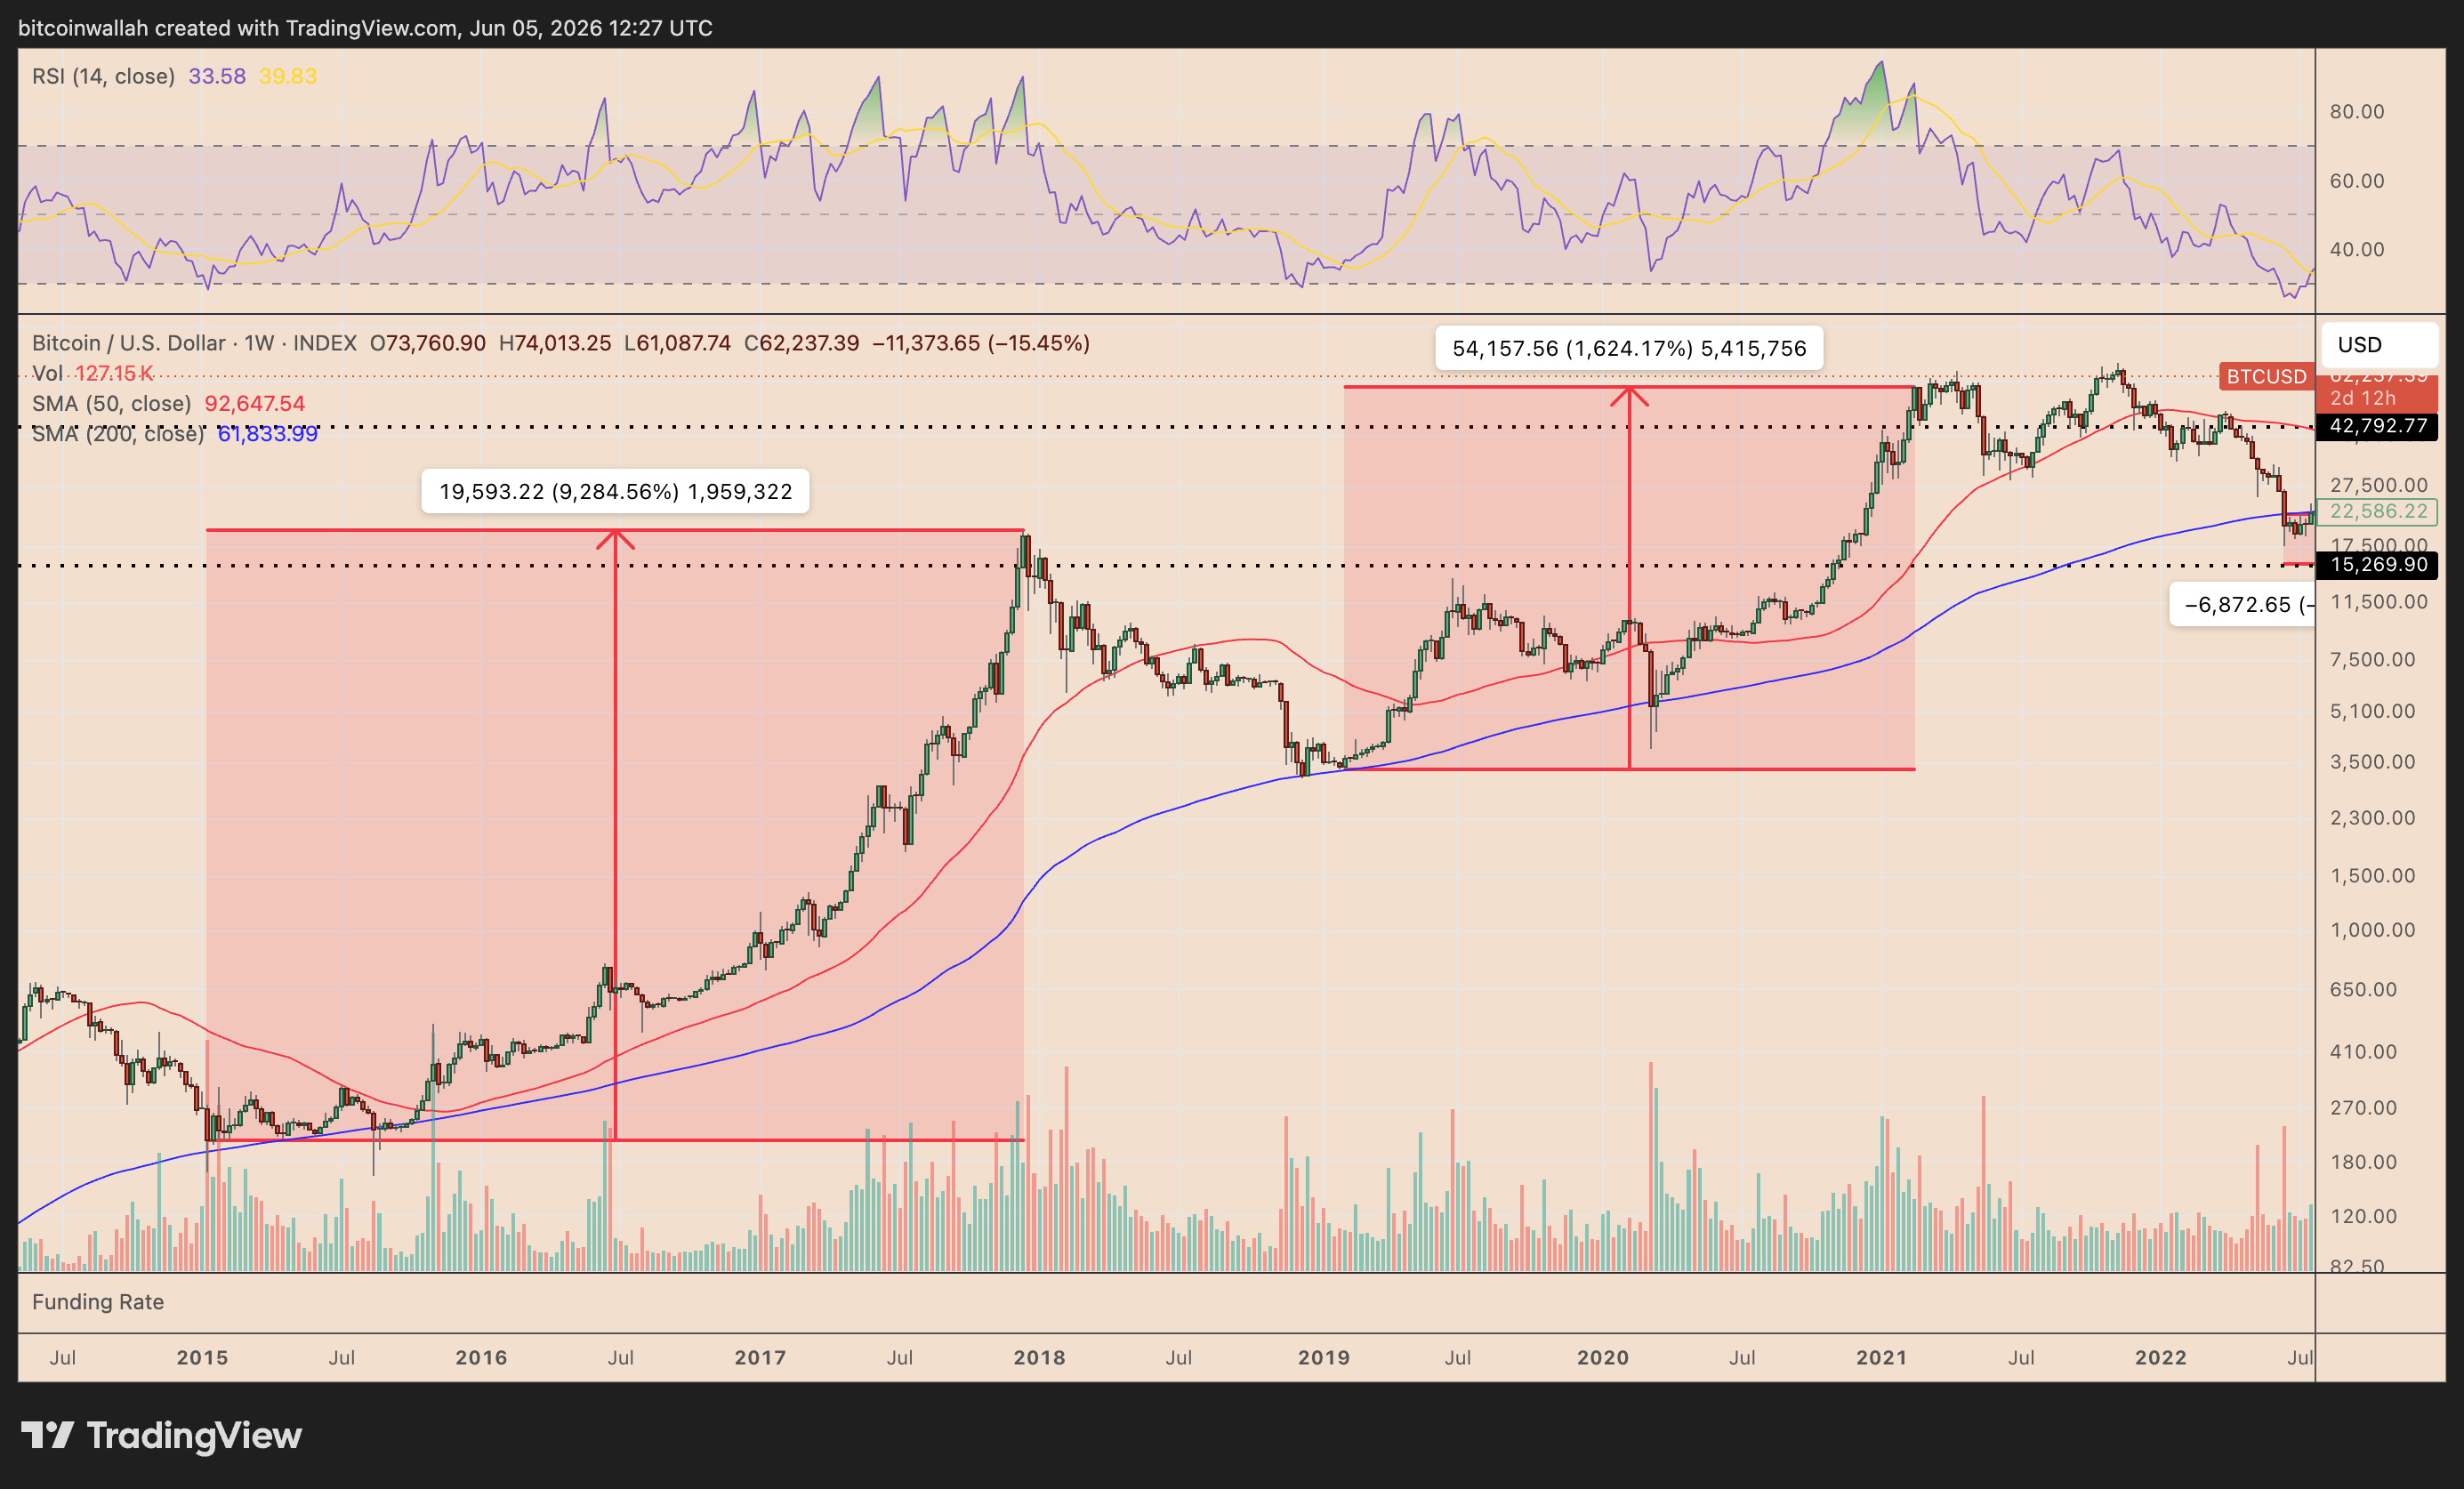
The March 2020 COVID crash also saw Bitcoin briefly wick into the 200-week SMA zone before launching into a rally of more than 1,500% over the next year.
Even in 2022, when BTC broke below the 200-week SMA, the level remained important. Bitcoin spent months struggling around it before reclaiming the line in early 2023. From that reclaim, BTC rallied more than 600% into its next major cycle high.

If BTC holds the 200-week SMA, bulls can still argue that the market is forming another deep-cycle support base. But if Bitcoin closes decisively below $61,800, the cycle-floor argument weakens sharply.
Bitcoin Price Forecast
Every new Bitcoin analysis as it publishes, today's technical signal and key levels, live price — on one page.
See all Bitcoin forecastsBitcoin Bear Flag Breakdown Points Toward $51K
The shorter-term chart adds more pressure.
On the 3-day timeframe, Bitcoin appears to have broken down from a bear flag, a continuation pattern that forms when price consolidates upward after a sharp decline before resuming its downtrend.
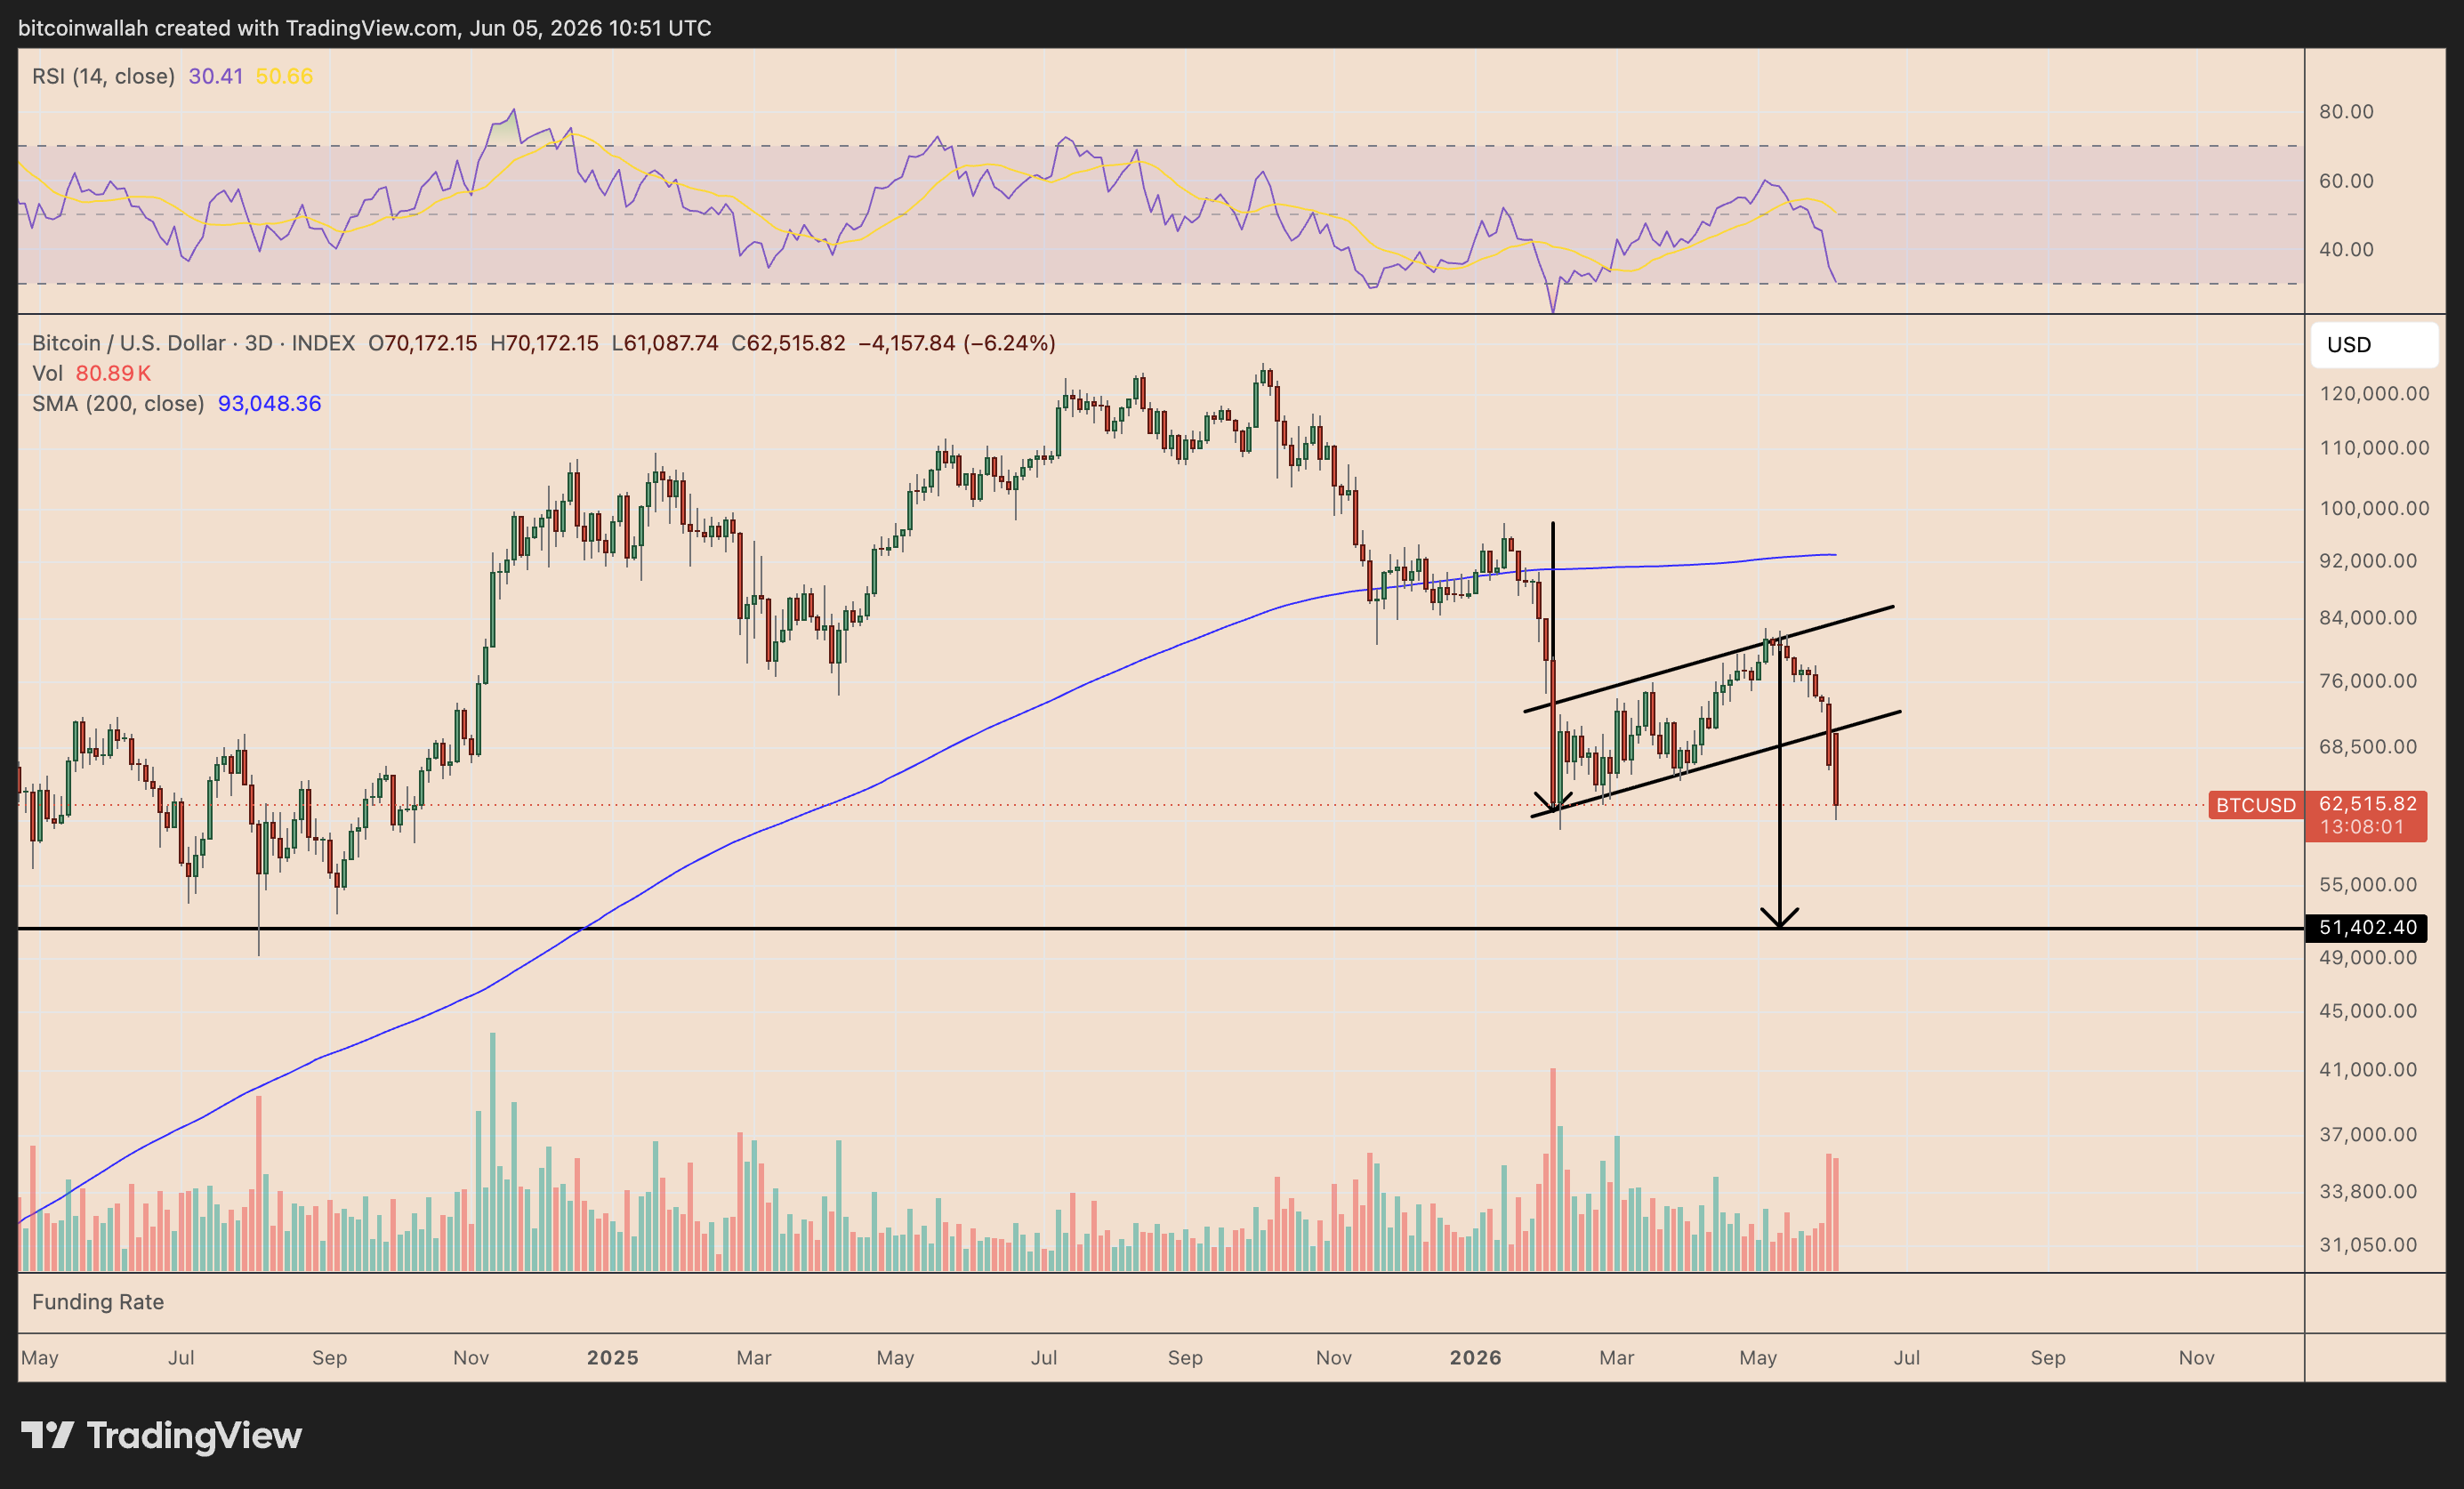
BTC has already fallen below the flag’s lower trendline, with the measured downside target sitting near $51,400.
That implies another potential 17% drop from current levels. The target also aligns with a previous horizontal support zone around $51,000–$52,000, making it the next key area to watch if the 200-week SMA fails.
The 3-day RSI has also fallen near 30, showing strong bearish momentum. While that puts BTC close to oversold territory, it does not guarantee a bottom. In strong downtrends, oversold conditions can persist while the price continues lower.
MVRV Bands Show Bitcoin Slipping Into Weak Valuation Zone
Glassnode’s MVRV Extreme Deviation Pricing Bands tell a similar story.
Bitcoin has lost the mean band and is now trading closer to the lower deviation ranges, showing that BTC has slipped out of its stronger valuation zone.
The current price is hovering near the minus 0.5 standard deviation band, while the lower bands sit closer to the $50,000–$55,000 region.
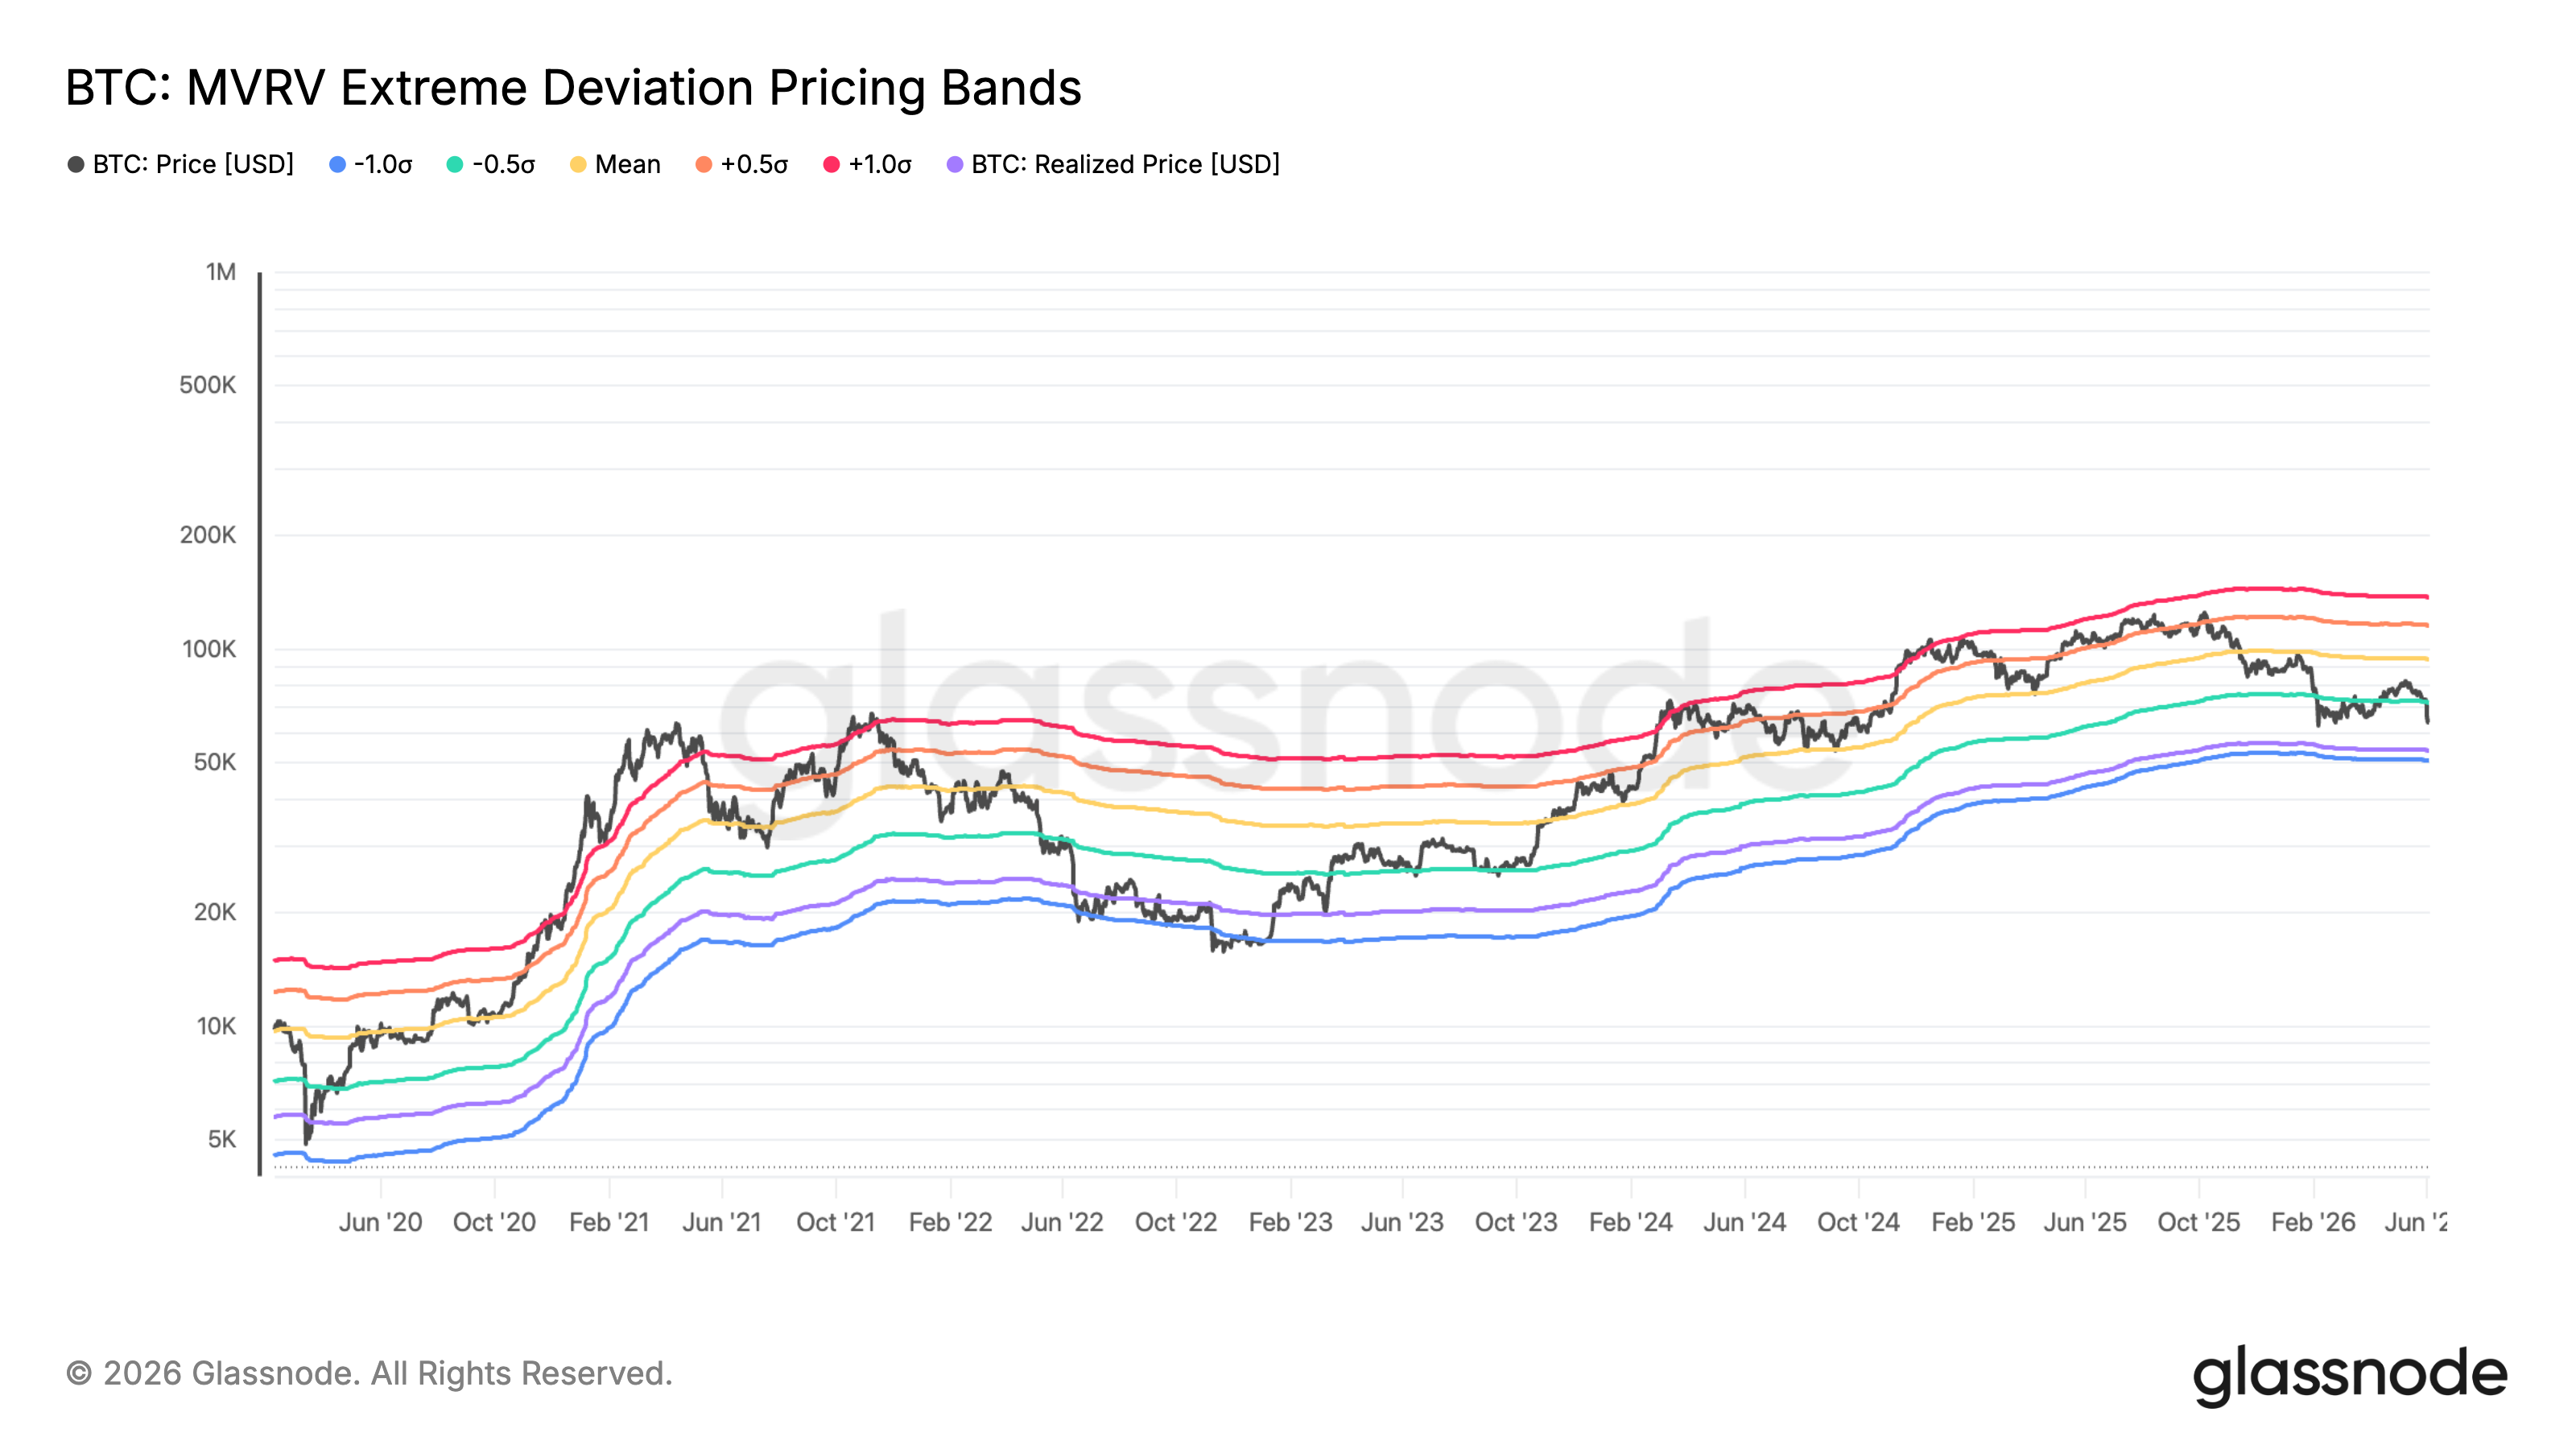
That overlaps with the bear-flag target near $51,400, creating a clear downside cluster.
In other words, three separate signals are now pointing to the same risk area: the weekly 200-week SMA near $61,800, the bear-flag target near $51,400, and MVRV valuation support in the low-$50,000s.
If Bitcoin loses $61,800, the first downside target is $51,000–$52,000. A full 2022-style breakdown could then put $42,000–$43,000 back on the table.