Earnings Catalyst Ignites a Strong Advance
AMC Entertainment Holdings, Inc. (AMC), operates the world’s largest movie theatre chain given their over 850 locations globally. Its stock spiked on Monday to an 18-day high of $2.48 on high volume, following the pre-market release of its Q2 2026 earnings report. The company posted record-breaking revenues of $1.60 billion, exceeding consensus estimates. Daily volume reached its highest level since mid-2024, showing broad participation in the rally and confirming increased investor interest following the earnings release.

Technical Foundation Strengthens
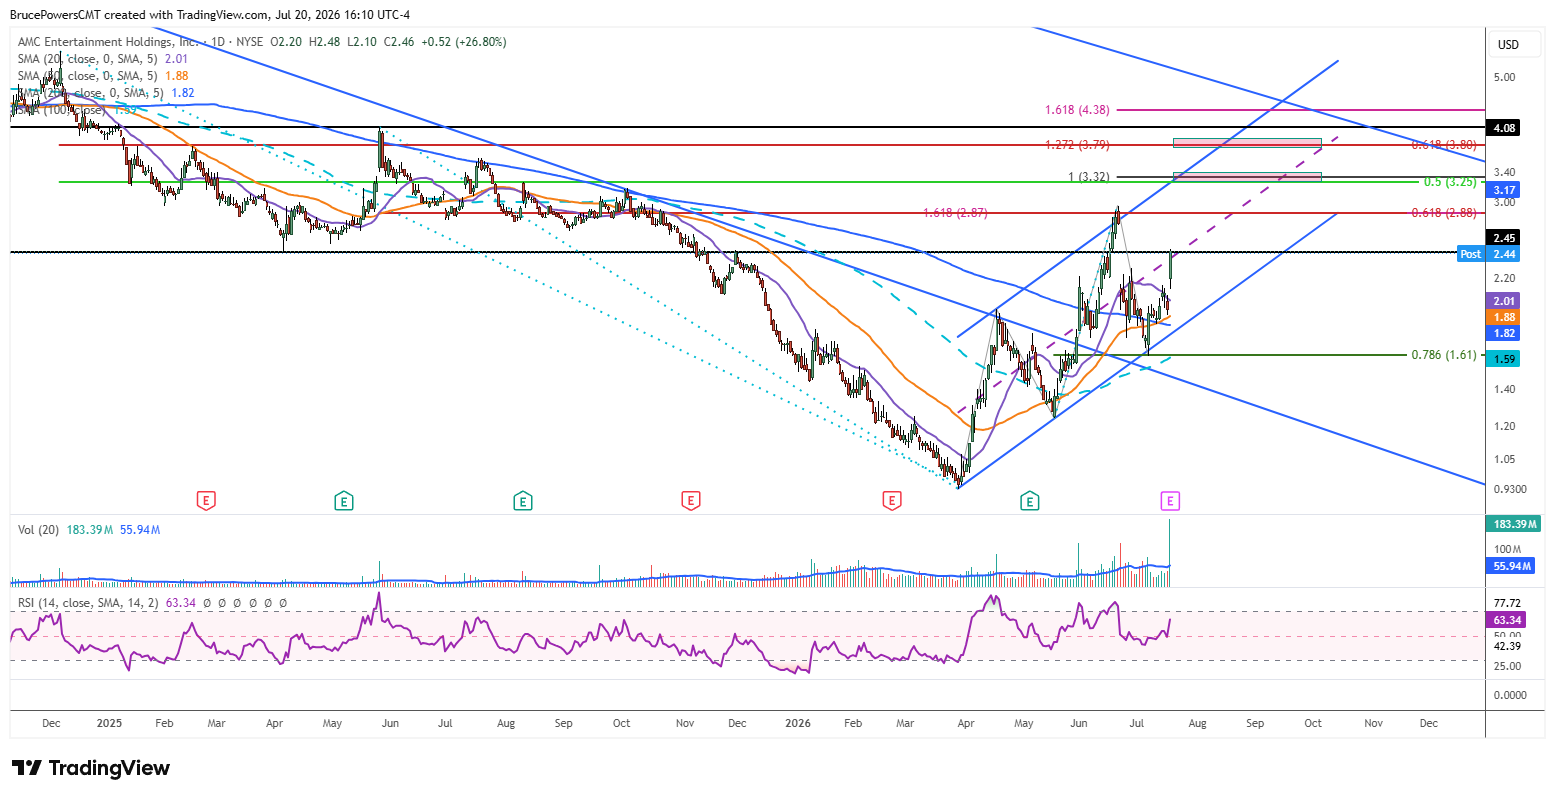
Technically, AMC stock is continuing an advance from a higher swing low of $1.60 that was established on July 8. That low completed a 78.6% Fibonacci retracement of the prior advance and confirmed the lower boundary of a rising trend channel. In addition, key dynamic support was indicated near the 100-day moving average. This confluence of technical support levels helped establish the foundation for the latest advance.
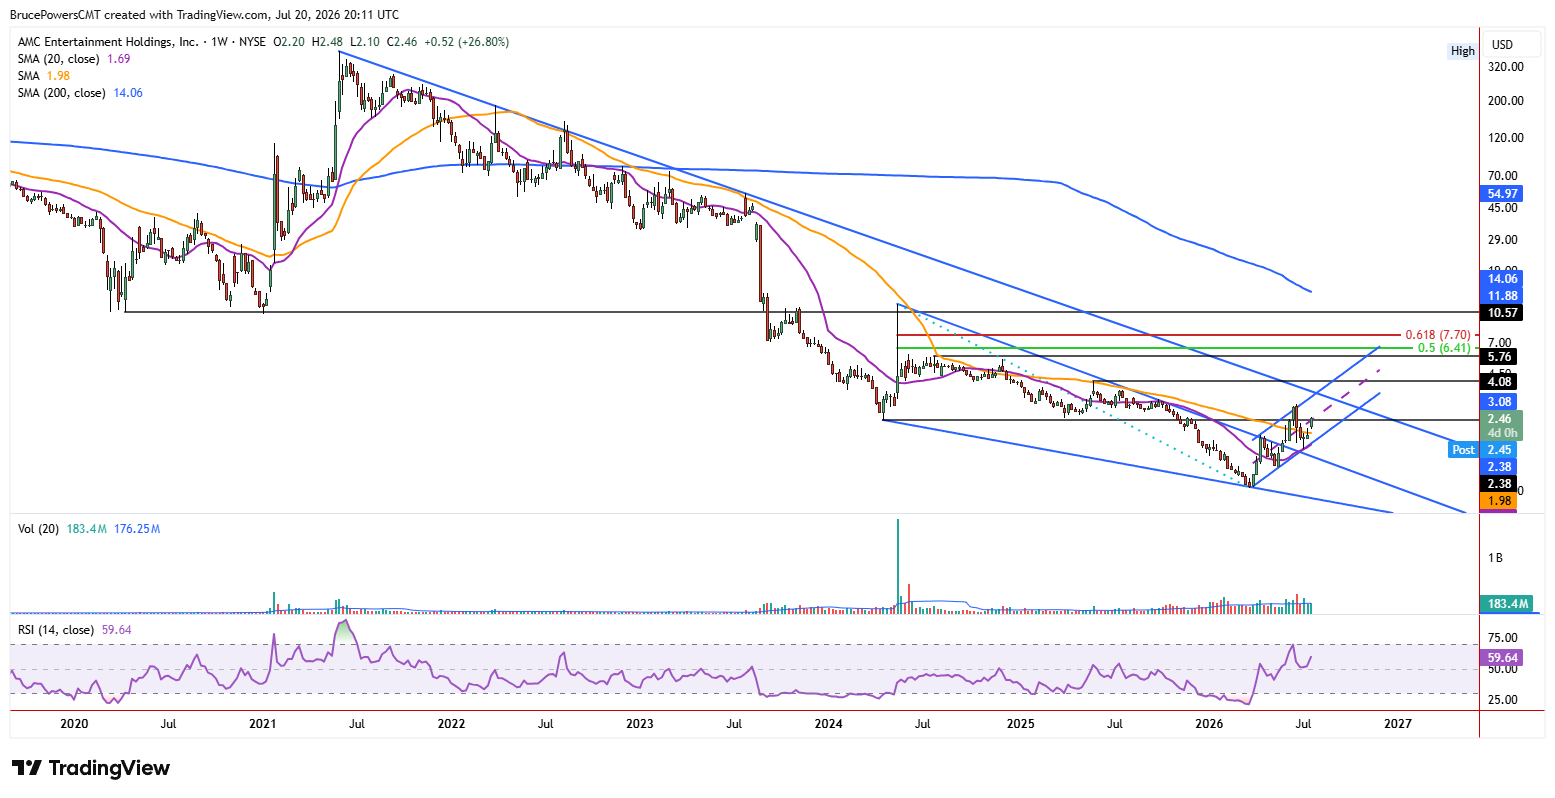
During Monday’s session, AMC gained approximately 26.8% to end at $2.46. That put the stock back above the 20-day moving average after confirming support near both the 50-day and 200-day moving averages over the past couple of weeks. This is bullish behavior that shows the continued reversal from a downtrend to an uptrend. The reclaim of the 200-day moving average is particularly notable since it follows an initial reclaim of that average during the advance in June. Maintaining this position above key moving averages would further strengthen the improving technical picture.
Resistance Levels Define the Next Test
The progression of the rising trend channel structure suggests a potential target near the top boundary of the channel. However, the first upside target is the recent trend high of $2.96. If that level is exceeded, there is a small confluence zone defining an upside target near $3.25 to $3.32, consisting of the 50% retracement of a prior decline and the 100% projection of a rising ABCD pattern, respectively, that begins from the higher swing low in May.
During the June rally, resistance emerged at the confluence of a 61.8% Fibonacci retracement of a prior decline and the 161.8% Fibonacci projection of a prior rising ABCD pattern that forms the rising channel. A similar reaction near upcoming resistance levels will determine whether the current advance develops into a broader continuation of the emerging uptrend.
If you’d like to know more about technical analysis and how traders use it, please visit our educational area.