

Nearly $200M Worth of Crypto Positions Liquidated
On Tuesday, BTC tumbled by over 1% to reach an intraday low at around $76,435. Ether (ETH), the second-largest crypto by market cap, was down by over 1.40%, while XRP dipped 1.20% in the same period.
Hyperliquid (HYPE) and Zcash (ZEC), among the best-performing tokens recently, were down roughly 4.5% and 6.5%, respectively.
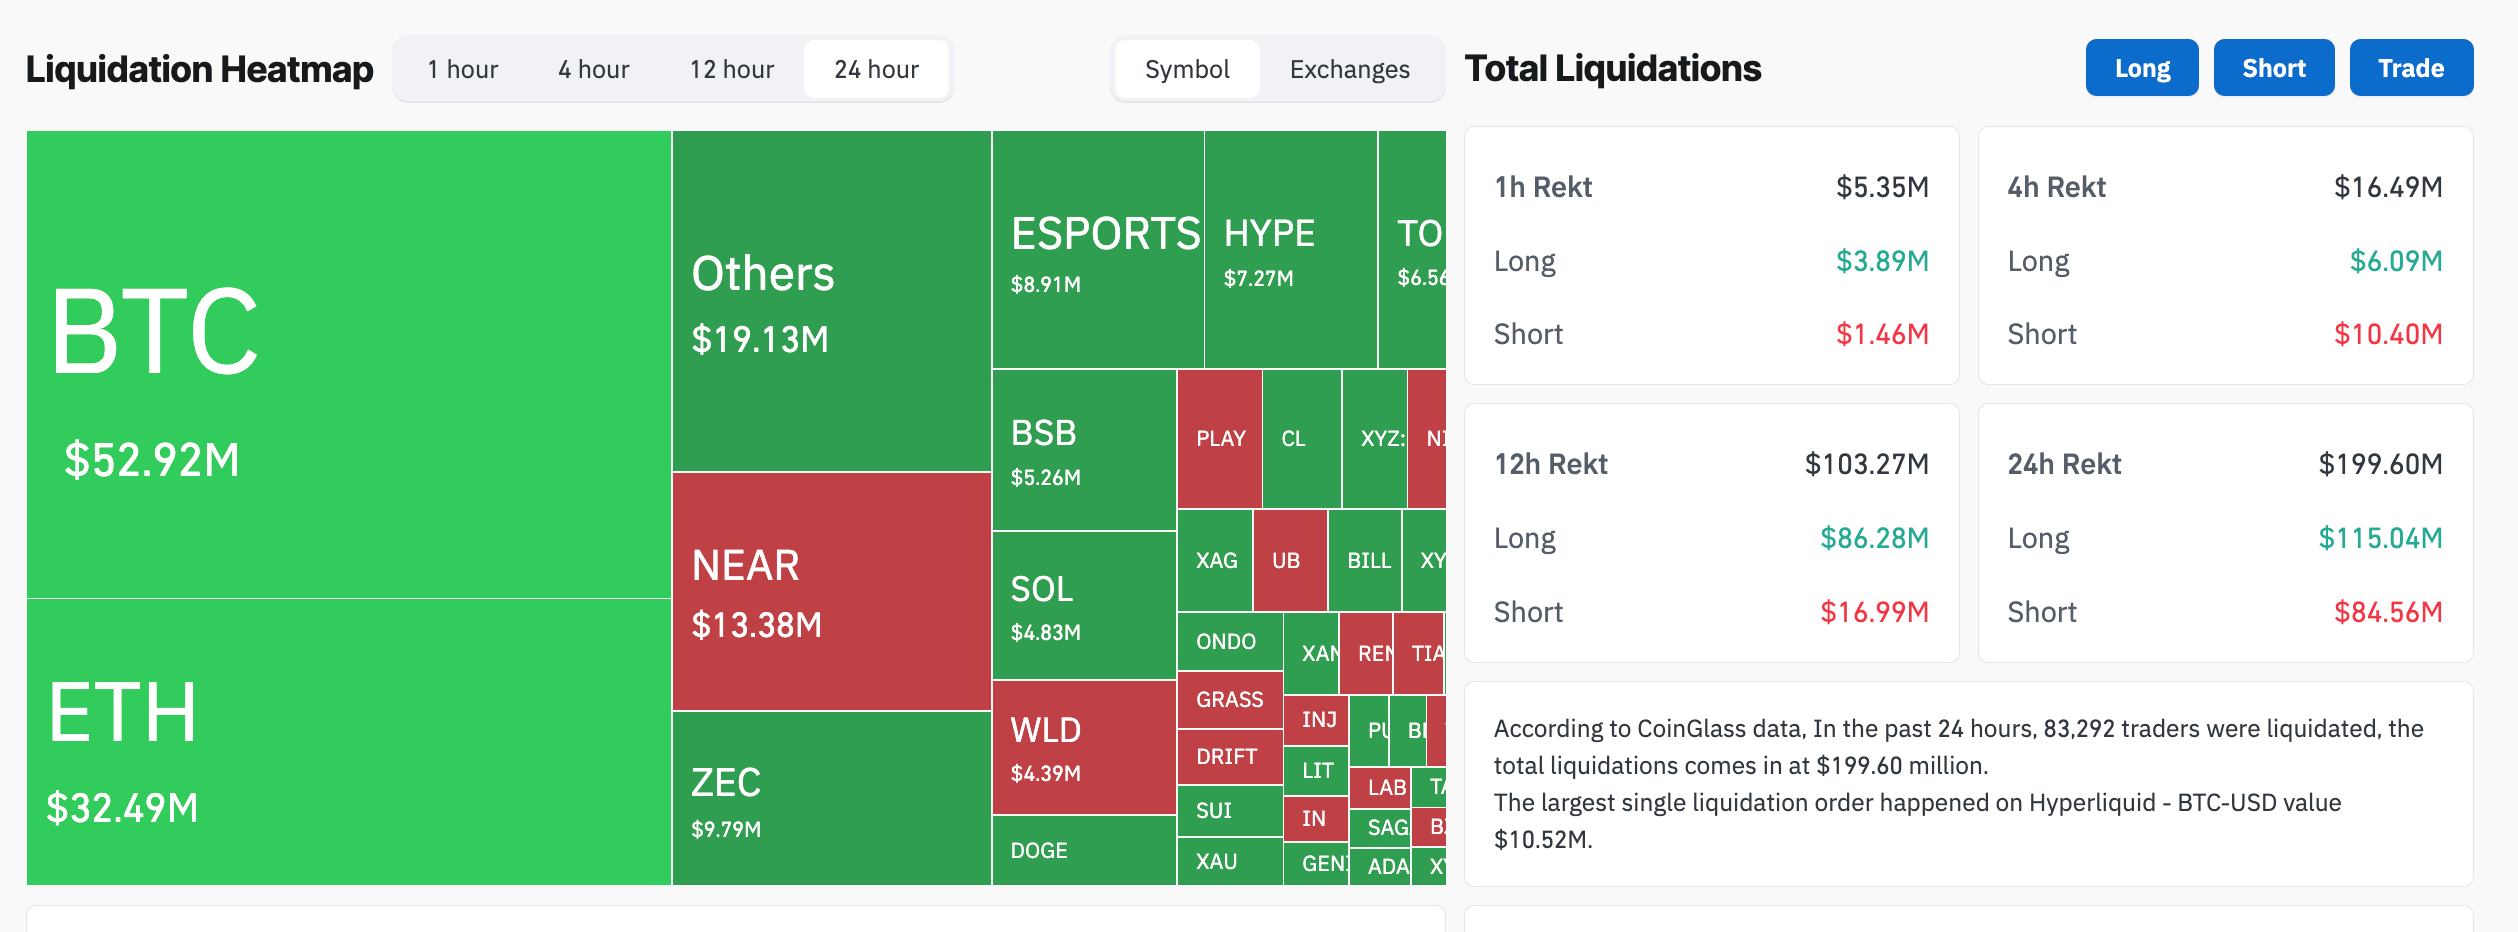
The zigzag moves in the past 24 hours liquidated about $200 million in crypto positions, according to data resource CoinGlass. That included over $115 million in long positions, indicating that the sudden US attack caught bulls off guard.
US forces carried out strikes in southern Iran, framing the operation as defensive, even as Tehran’s top negotiator and foreign minister were in Doha for talks with Qatar’s prime minister on a possible deal with Washington to end the three-month-old war.
However, US Secretary of State Marco Rubio said negotiations with Iran could still “take a few days,” dampening expectations for an immediate end to the conflict.
The developments sent Brent Crude Oil rising 3.38% toward $100, but it was still down 15% from May top. Oil-led inflation has increased odds of the Federal Reserve to raise benchmark interest rates.
“Interest rates are set to rise through August,” said rating agency Weiss Crypto in a Monday post, adding:
“Oil is set to rise through mid-July. And this should cause Bitcoin to fall through mid-July as well.”
A decline in Bitcoin prices may ripple across the crypto market, hurting other top-ranking assets like ETH and XRP.
Bitcoin Price Forecast
Every new Bitcoin analysis as it publishes, today's technical signal and key levels, live price — on one page.
See all Bitcoin forecastsBitcoin Technical Analysis: Head and Shoulders Pattern Suggest More Pain
Bitcoin’s daily chart shows a developing head-and-shoulders pattern, a bearish reversal setup that suggests the recent recovery is losing momentum.
The left shoulder formed near $79,000, the head peaked around $82,000, and the right shoulder is now struggling below similar resistance. BTC is testing the neckline around $75,000–$76,000, where the 20-day and 50-day EMAs are also flattening.
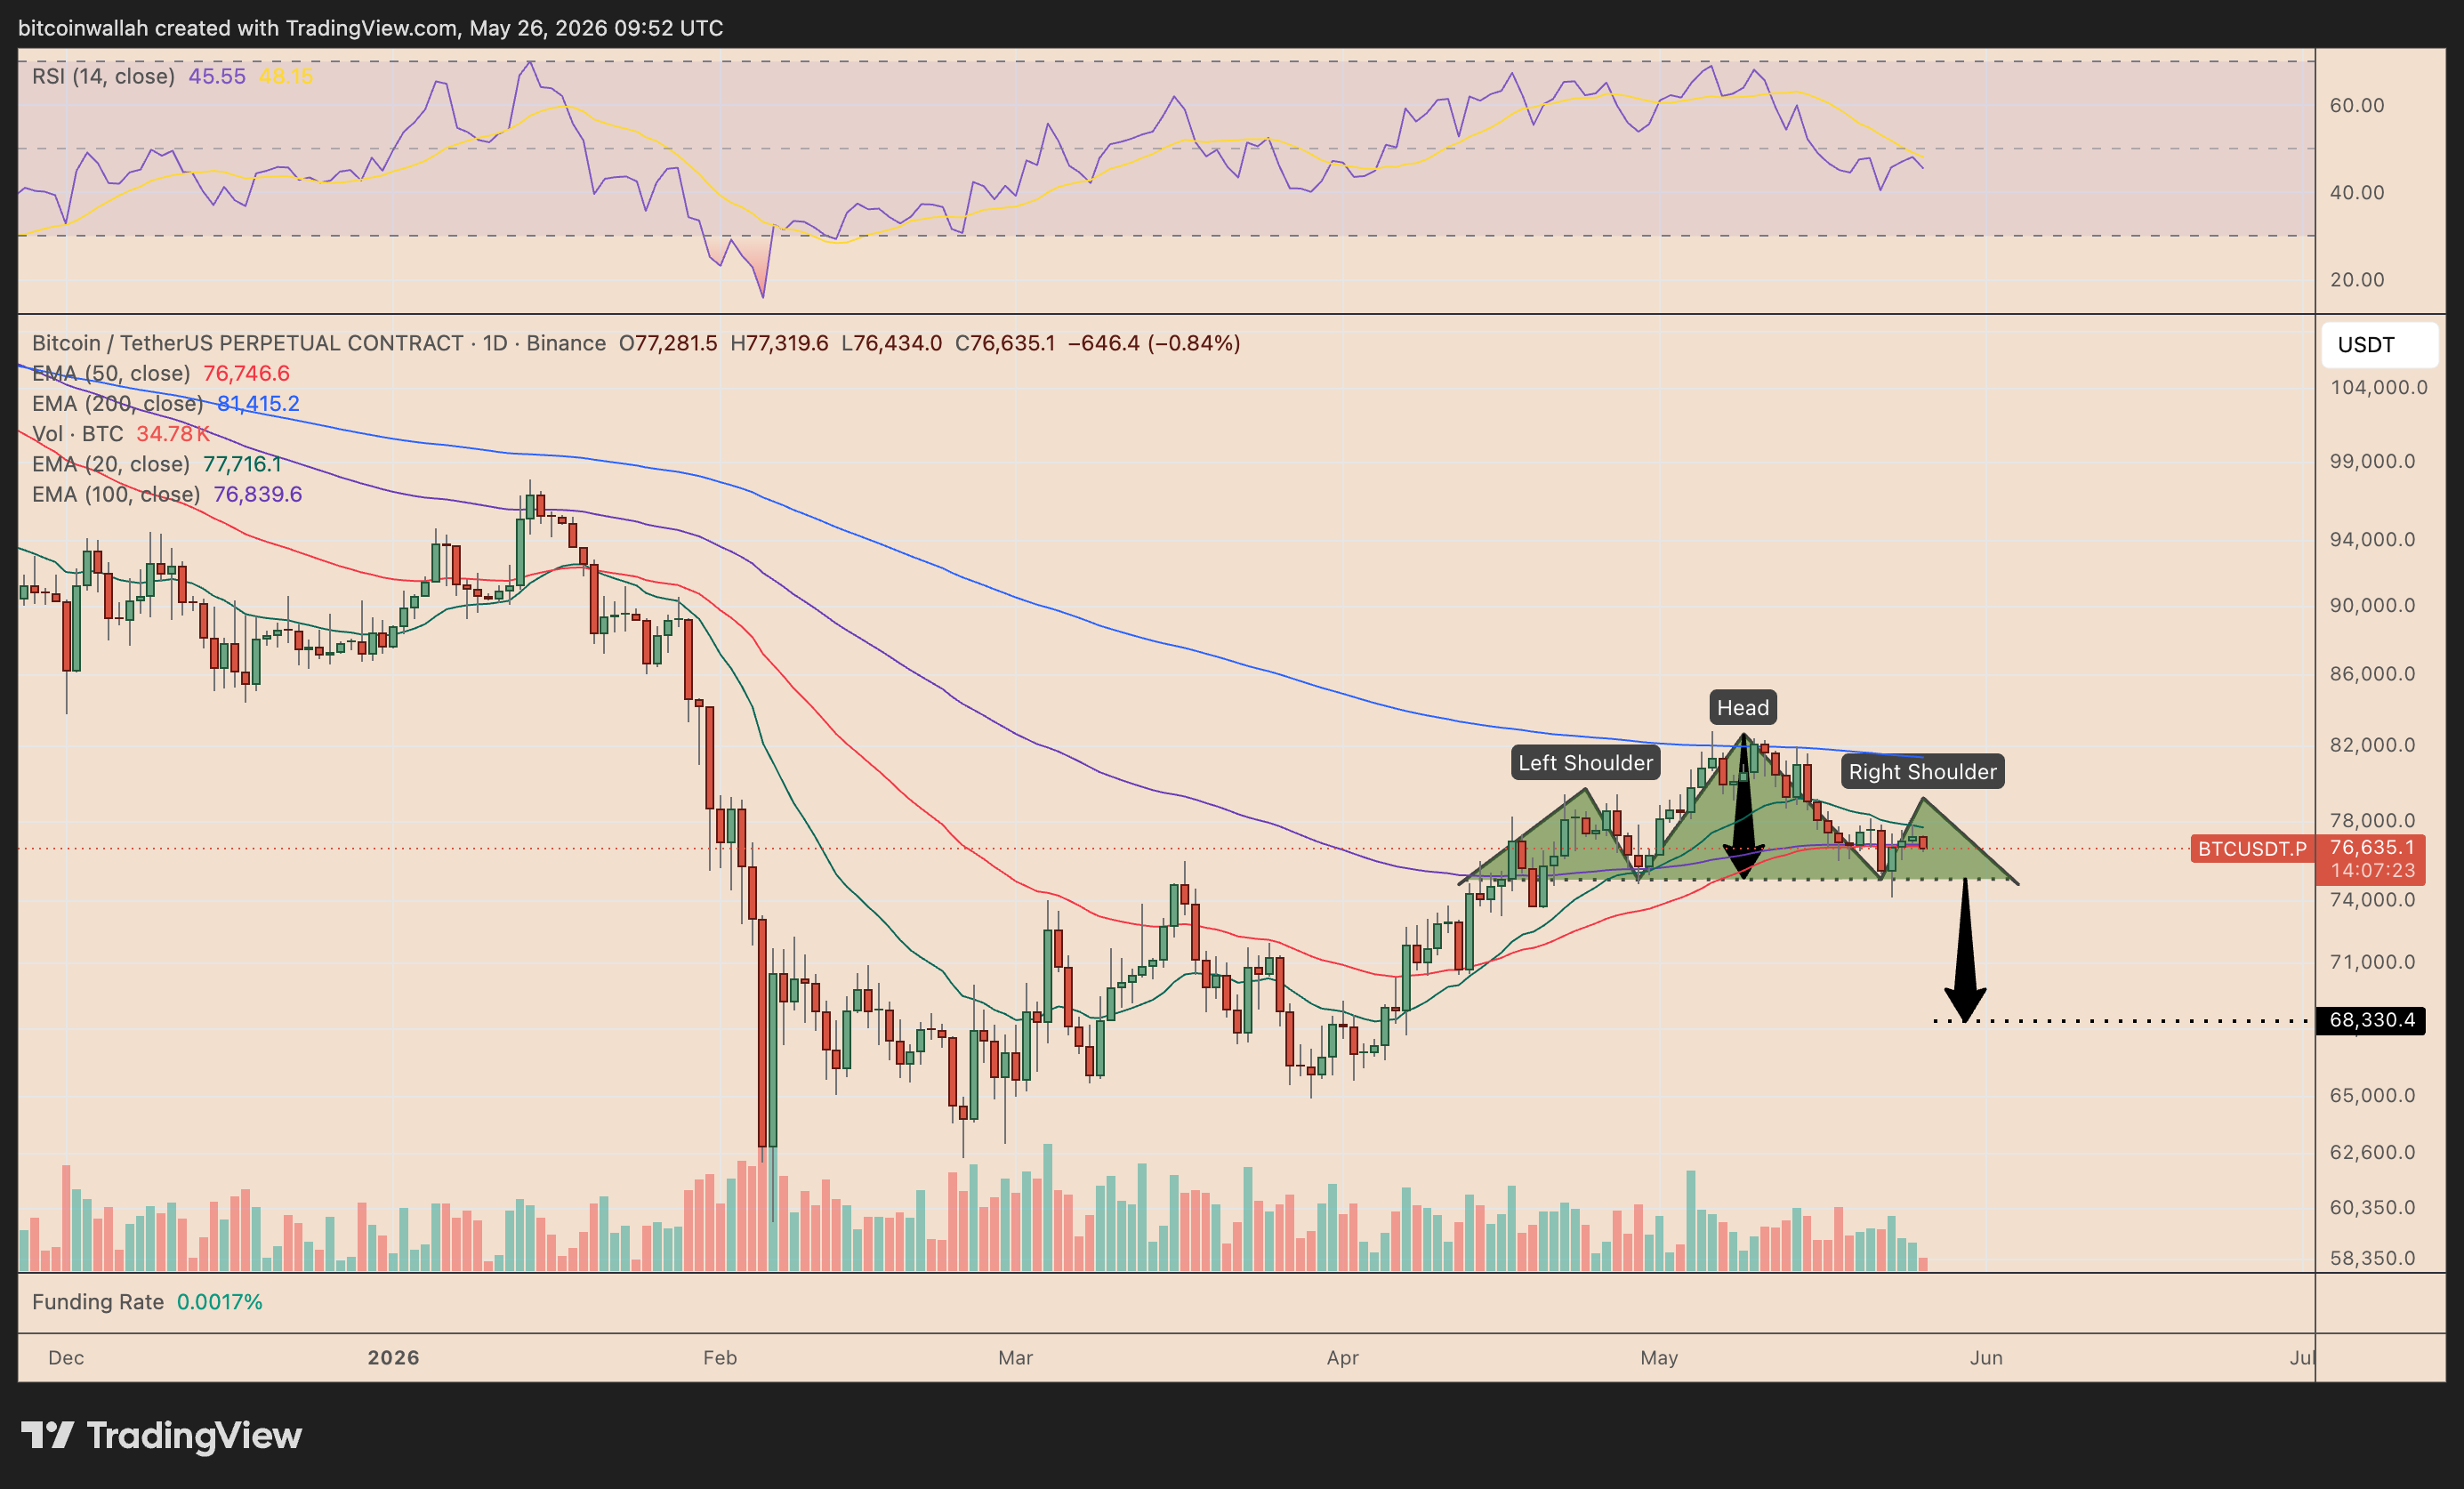
A decisive daily close below this zone could confirm the breakdown and trigger a measured move toward $68,300, based on the pattern’s height. Weak relative strength index readings, near the mid-40s, further support the downside risk.
XRP Technical Analysis: Symmterical Triangle Hints At 25% Dip Next
XRP’s symmetrical triangle breakdown appears to be underway, with price slipping below the pattern’s lower trendline after weeks of tightening consolidation.
The move suggests sellers are gaining control as XRP struggles to reclaim the $1.38–$1.45 resistance zone, where the 20-day, 50-day and 100-day EMAs are clustered.
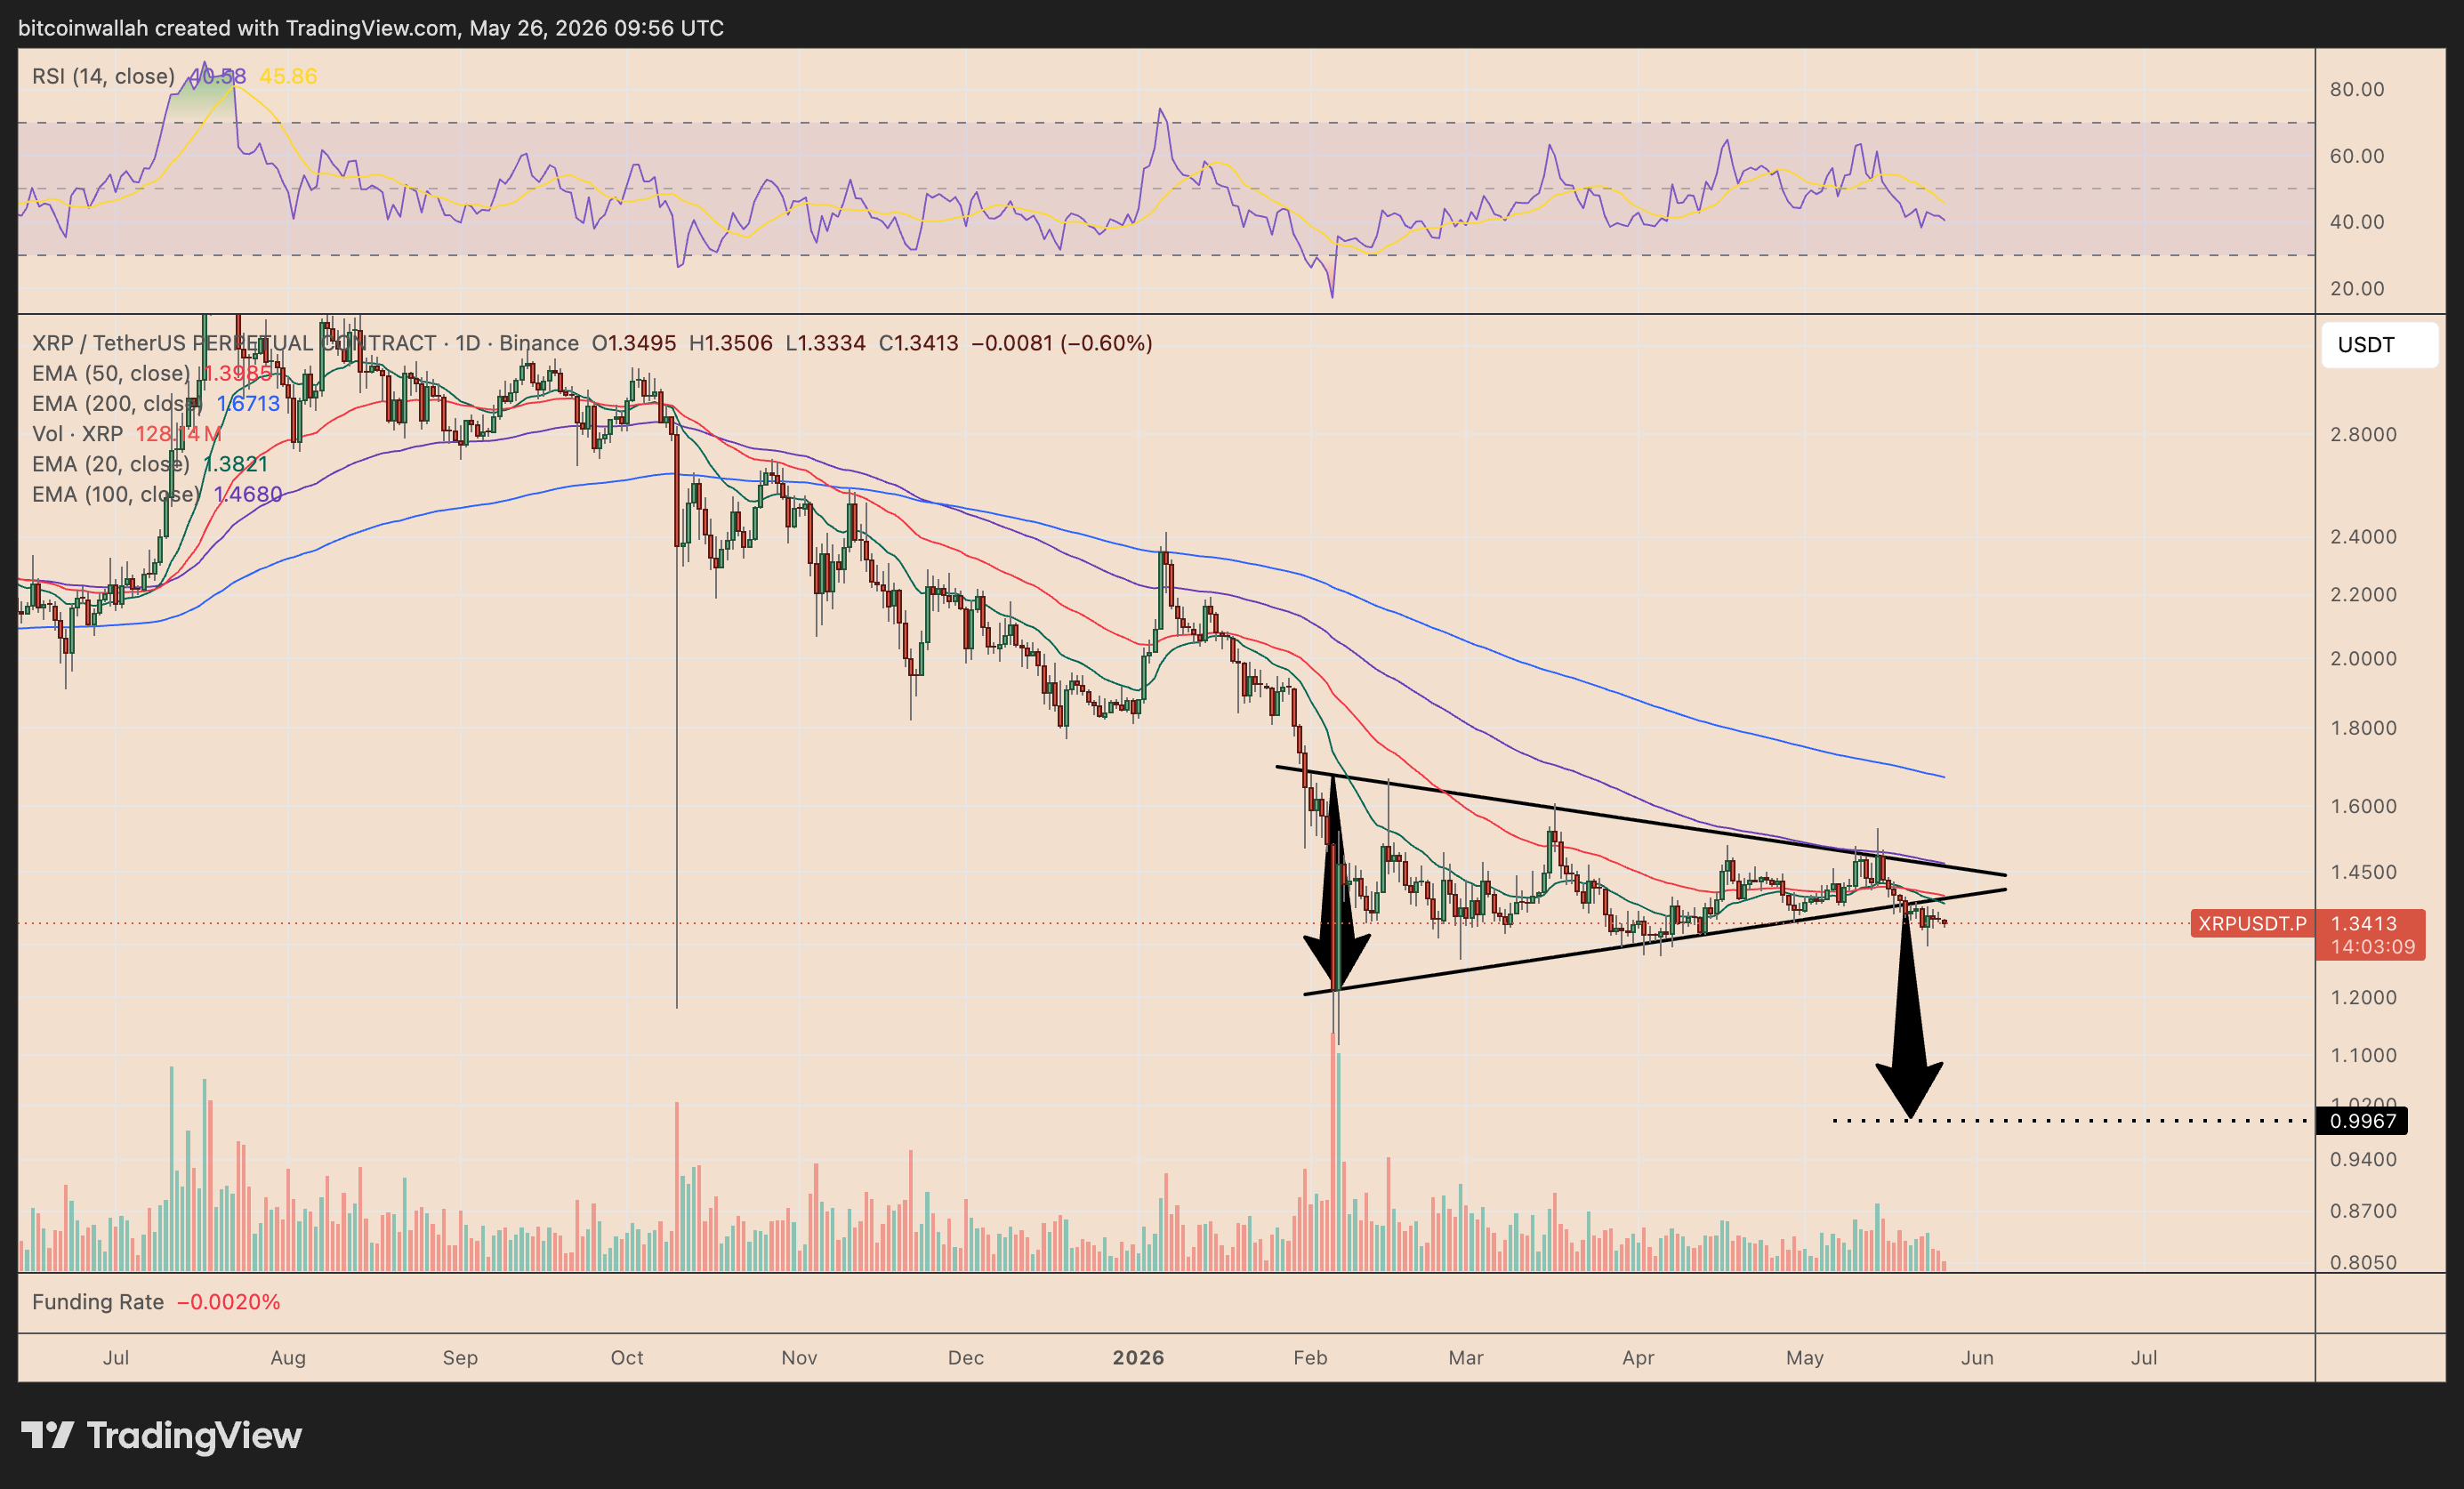
A confirmed daily close below the triangle support could strengthen the bearish setup and expose XRP to a measured decline toward the $0.99–$1.00 area, down roughly 25% from current levels.
Weak RSI momentum near 40 adds to the downside risk, showing buyers have yet to regain control.