Bitcoin (BTC) retreated slightly in the past couple of days after hitting the $64,000 threshold, following President Trump’s renewed threats on Iran.
The head of state ended the ceasefire between the two nations yesterday, and the U.S. military struck the Middle Eastern country at night after weeks of unproductive negotiations.
Even though Trump claimed that Iran approached the U.S. to negotiate again, he is not fully willing to make a deal right now.
This kind of uncertainty has put a lid on Bitcoin’s upside potential and could keep the token trading relatively range-bound during the next few days.
However, on-chain metrics show that the end of this bearish cycle could be near, in line with what we have been stating for a while as well.

Short-Term Holders Got Wrecked Again – That’s Good for BTC
According to data from Glassnode, realized losses suffered by short-term holders (STH) of BTC have spiked to levels that have only been seen on six previous occassions. In all of these instances, BTC traded either near or at its cycle bottom.
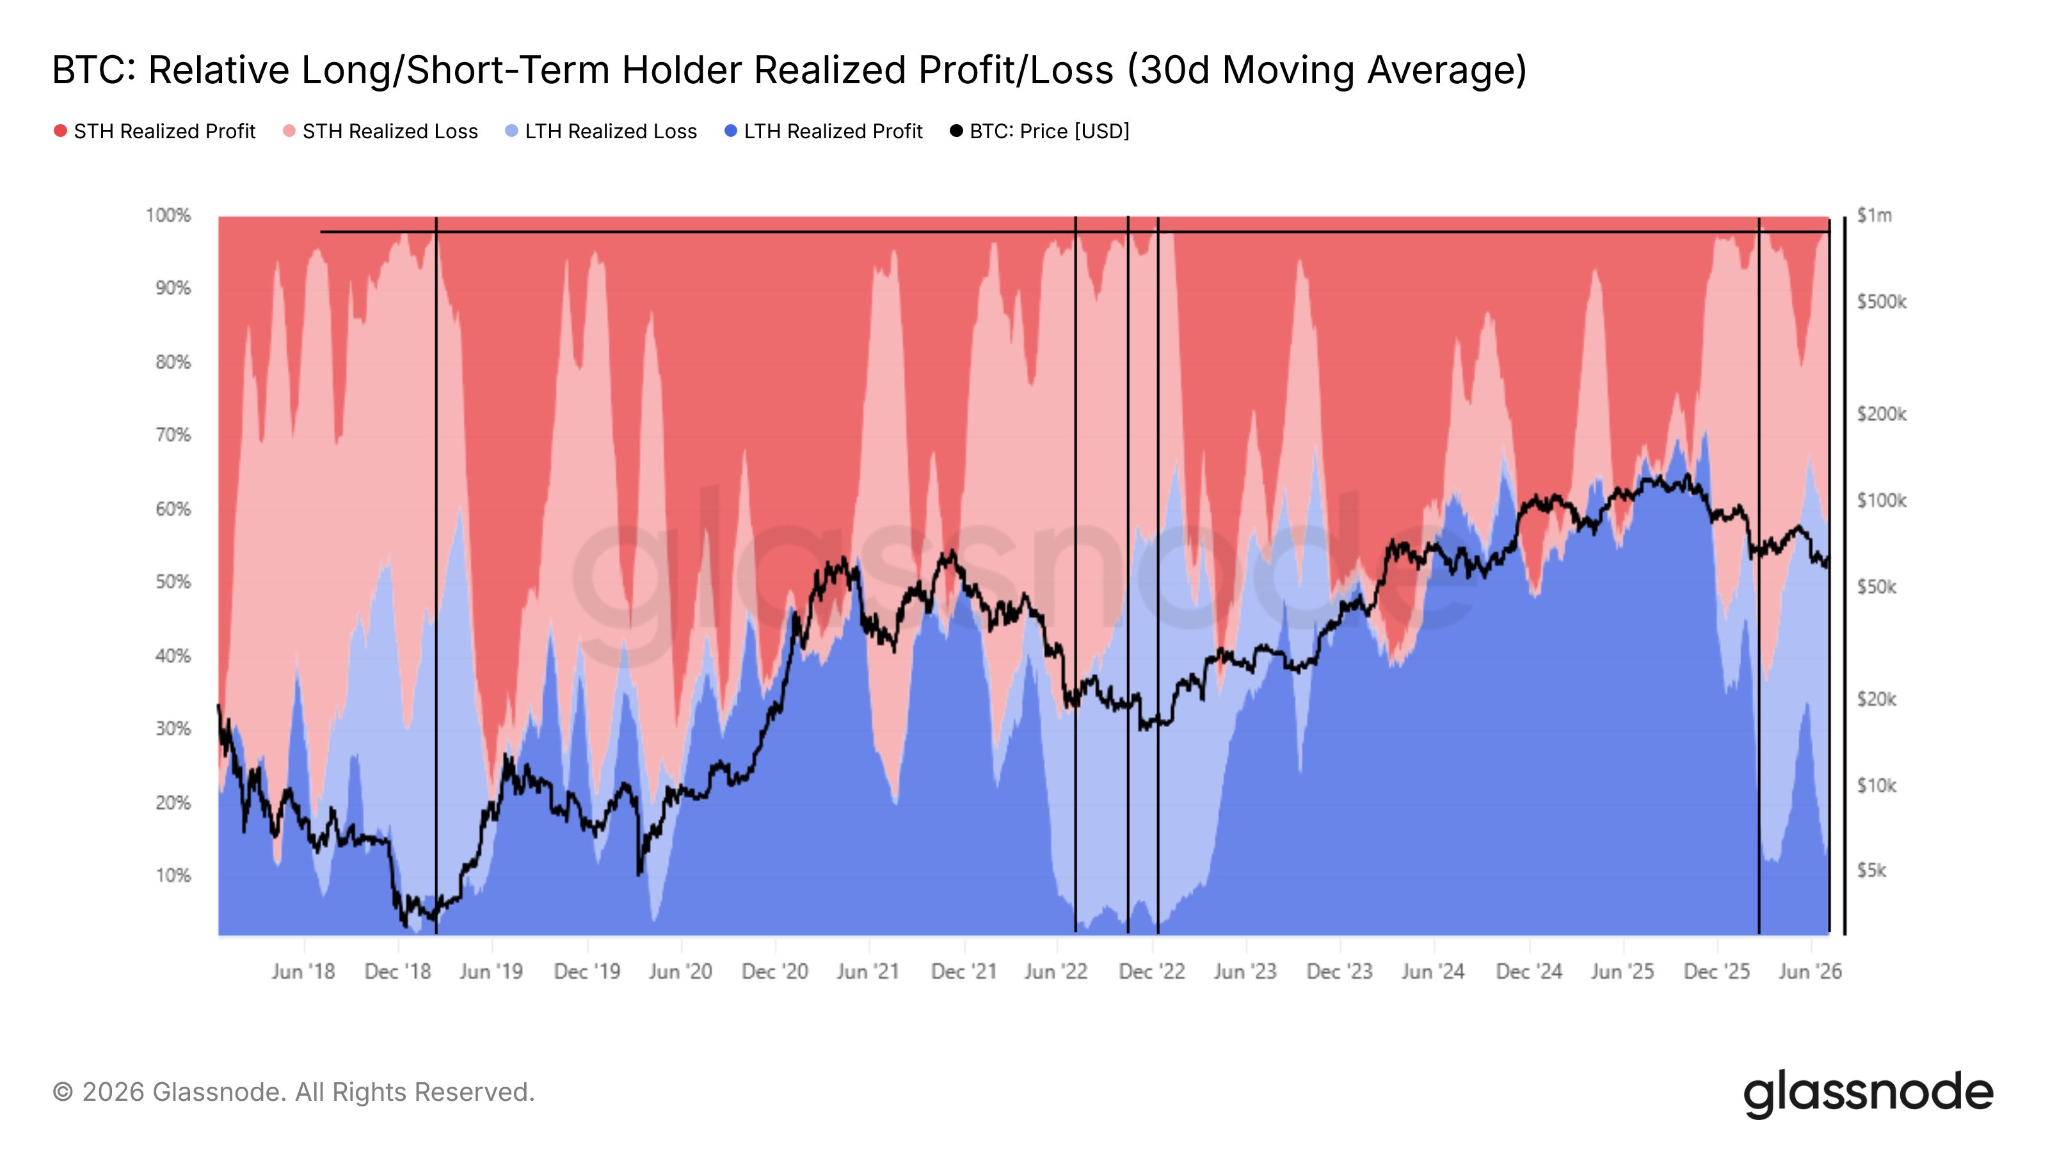
The last time this metric hit this area was in January this year, back when BTC hit the previous cycle low of $60,000. What happened afterward was a strong recovery to $82,000.
Now, we have made a new cycle low, and this could be a definite one if we use these historical patterns as a reference. Short-term holders have probably capitulated, creating room for long-term holders to start grabbing BTC at this low price.
This could create a strong floor for the top crypto while whale activity confirms this behavior.
Bitcoin Price Forecast
Every new Bitcoin analysis as it publishes, today's technical signal and key levels, live price — on one page.
See all Bitcoin forecastsWhale Accumulation Continues Despite Persistent Price Volatility
We stated in a previous Bitcoin price prediction article that whales have added another 10,000 BTC tokens to their stash this month.
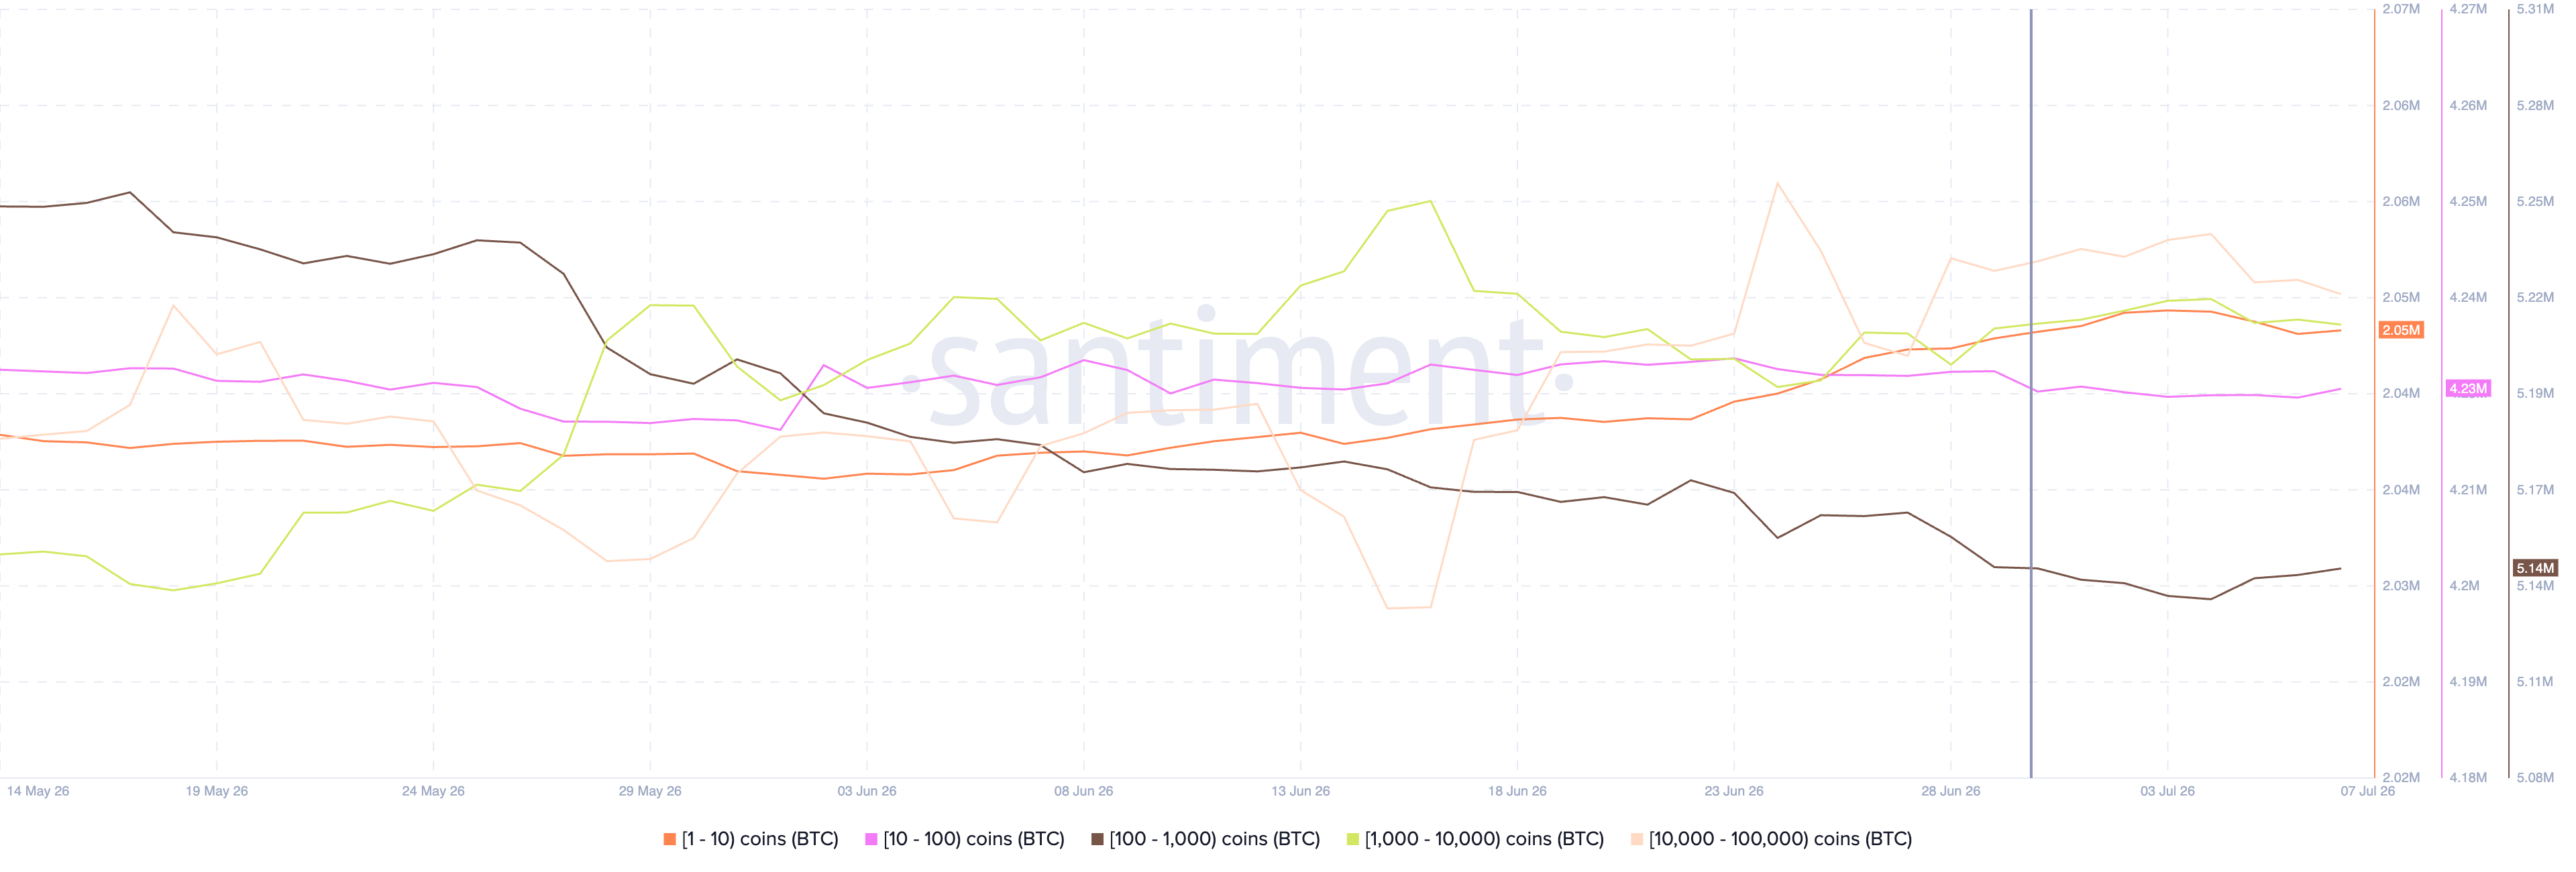
The last two months also ended with positive additions to whale wallets, meaning that the market could have entered an accumulation phase.
The price action during these phases tends to be pretty muted. A consolidation pattern usually forms as a result of whales’ ongoing accumulation until a break above a certain price mark occurs and FOMO starts to kick in.
BTC Needs to Break Above $66,000 to Resume Its Rally
A W-shaped pattern has formed in the daily chart that tends to precede strong rallies. The neckline of this pattern tends to be the key area to watch to confirm a bullish breakout.
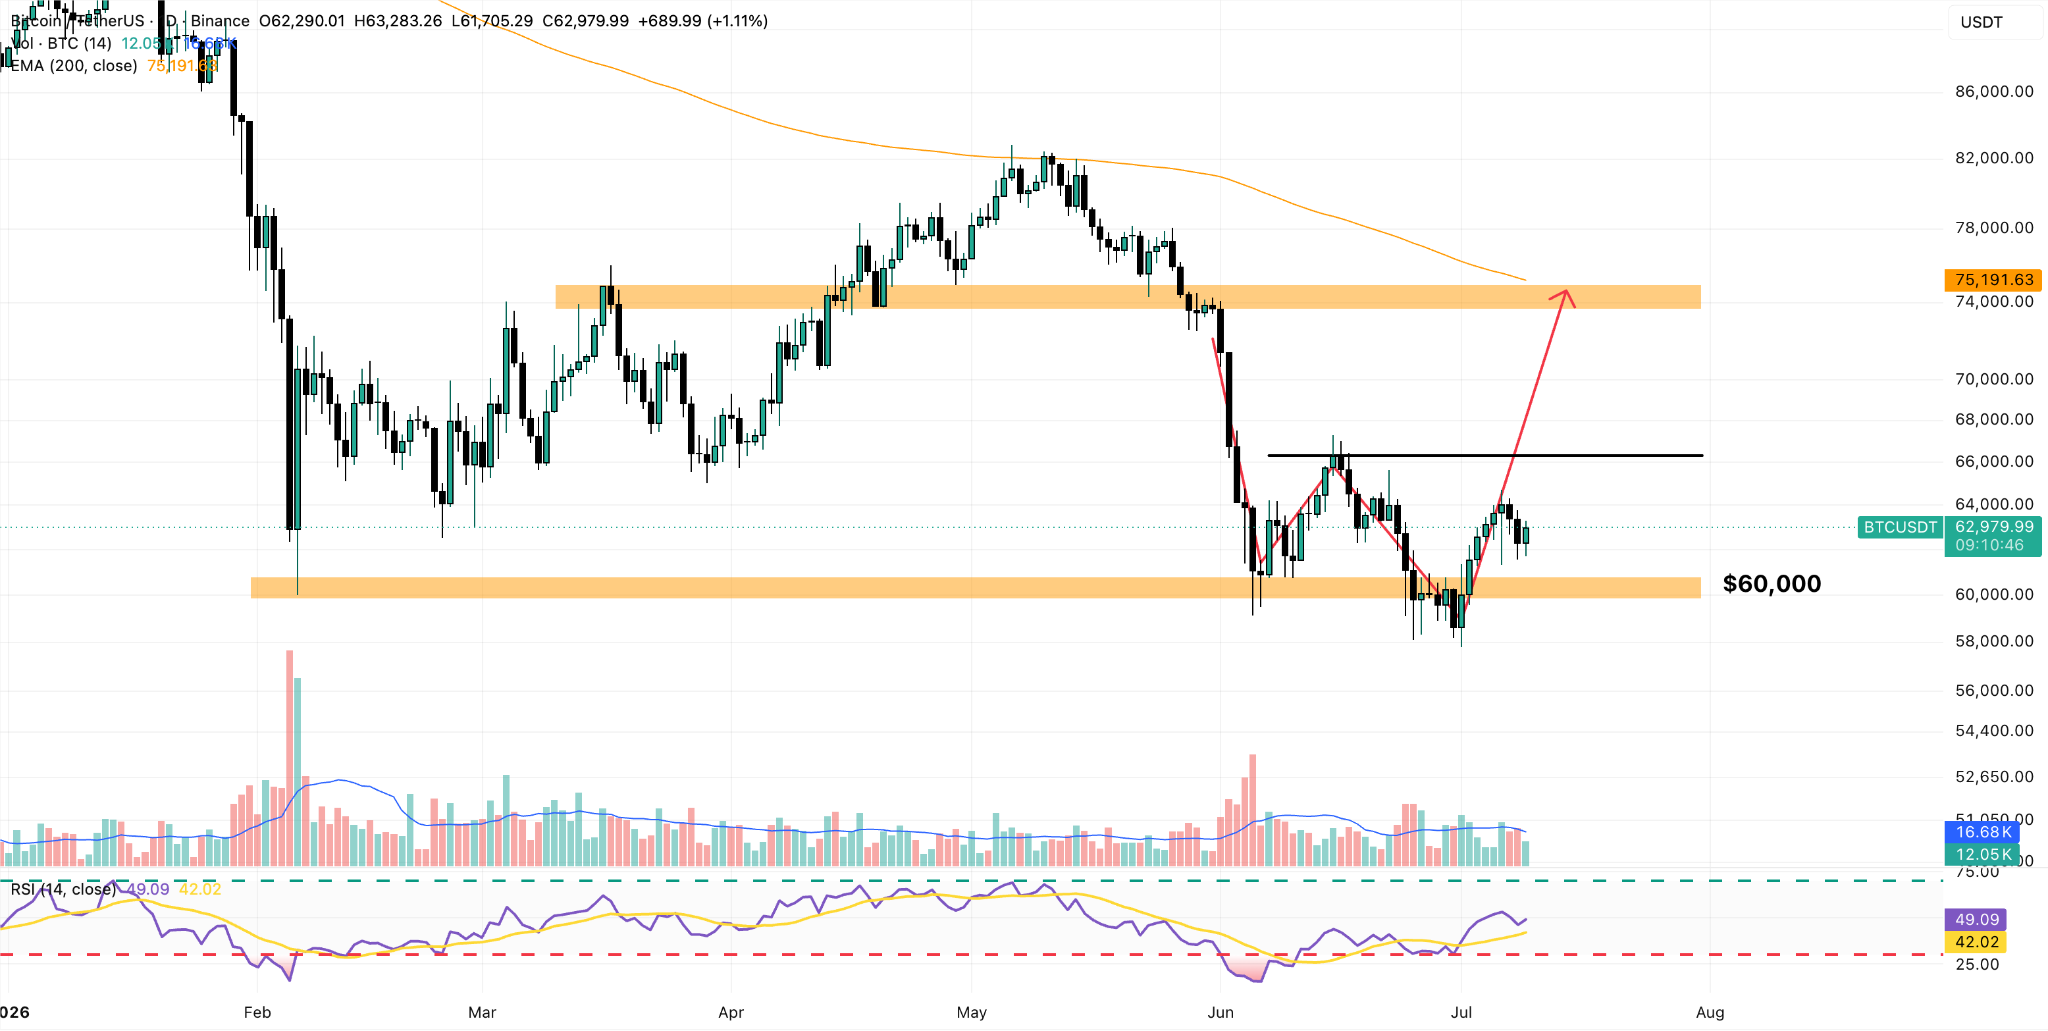
In Bitcoin’s case, the price needs to rise past the $66,000 mark to get things going. Meanwhile, the market might need to go down to $60K again to raise the necessary liquidity to pull that off.
The Relative Strength Index (RSI) is still below the 50 mark. Hence, we have not received confirmation from any of these indicators or the price action that justifies a bullish outlook.
However, we continue to believe that the lowest BTC will go during this cycle will be $50,000, which could occur if the price dips below $60,000.
In contrast, if the price stays above this mark, we expect a retest of the 200-day exponential moving average (EMA) at around $74,000 in the near term.