Dogecoin (DOGE) has crashed roughly 50% over the past year, and renewed US–Iran attacks threaten to deepen the pain as oil-driven inflation fears revive Federal Reserve rate-hike bets.
DOGE Inverse Cup-and-Handle Setup Warns of More Losses
Dogecoin is showing signs of a bearish continuation on its four-hour chart after failing to sustain its early-July rebound.
The DOGE/USDT chart shows the memecoin forming an inverse cup-and-handle pattern. The setup typically develops when price forms a rounded top, returns to horizontal support, and then stages a weak recovery—the “handle”—before potentially breaking lower.
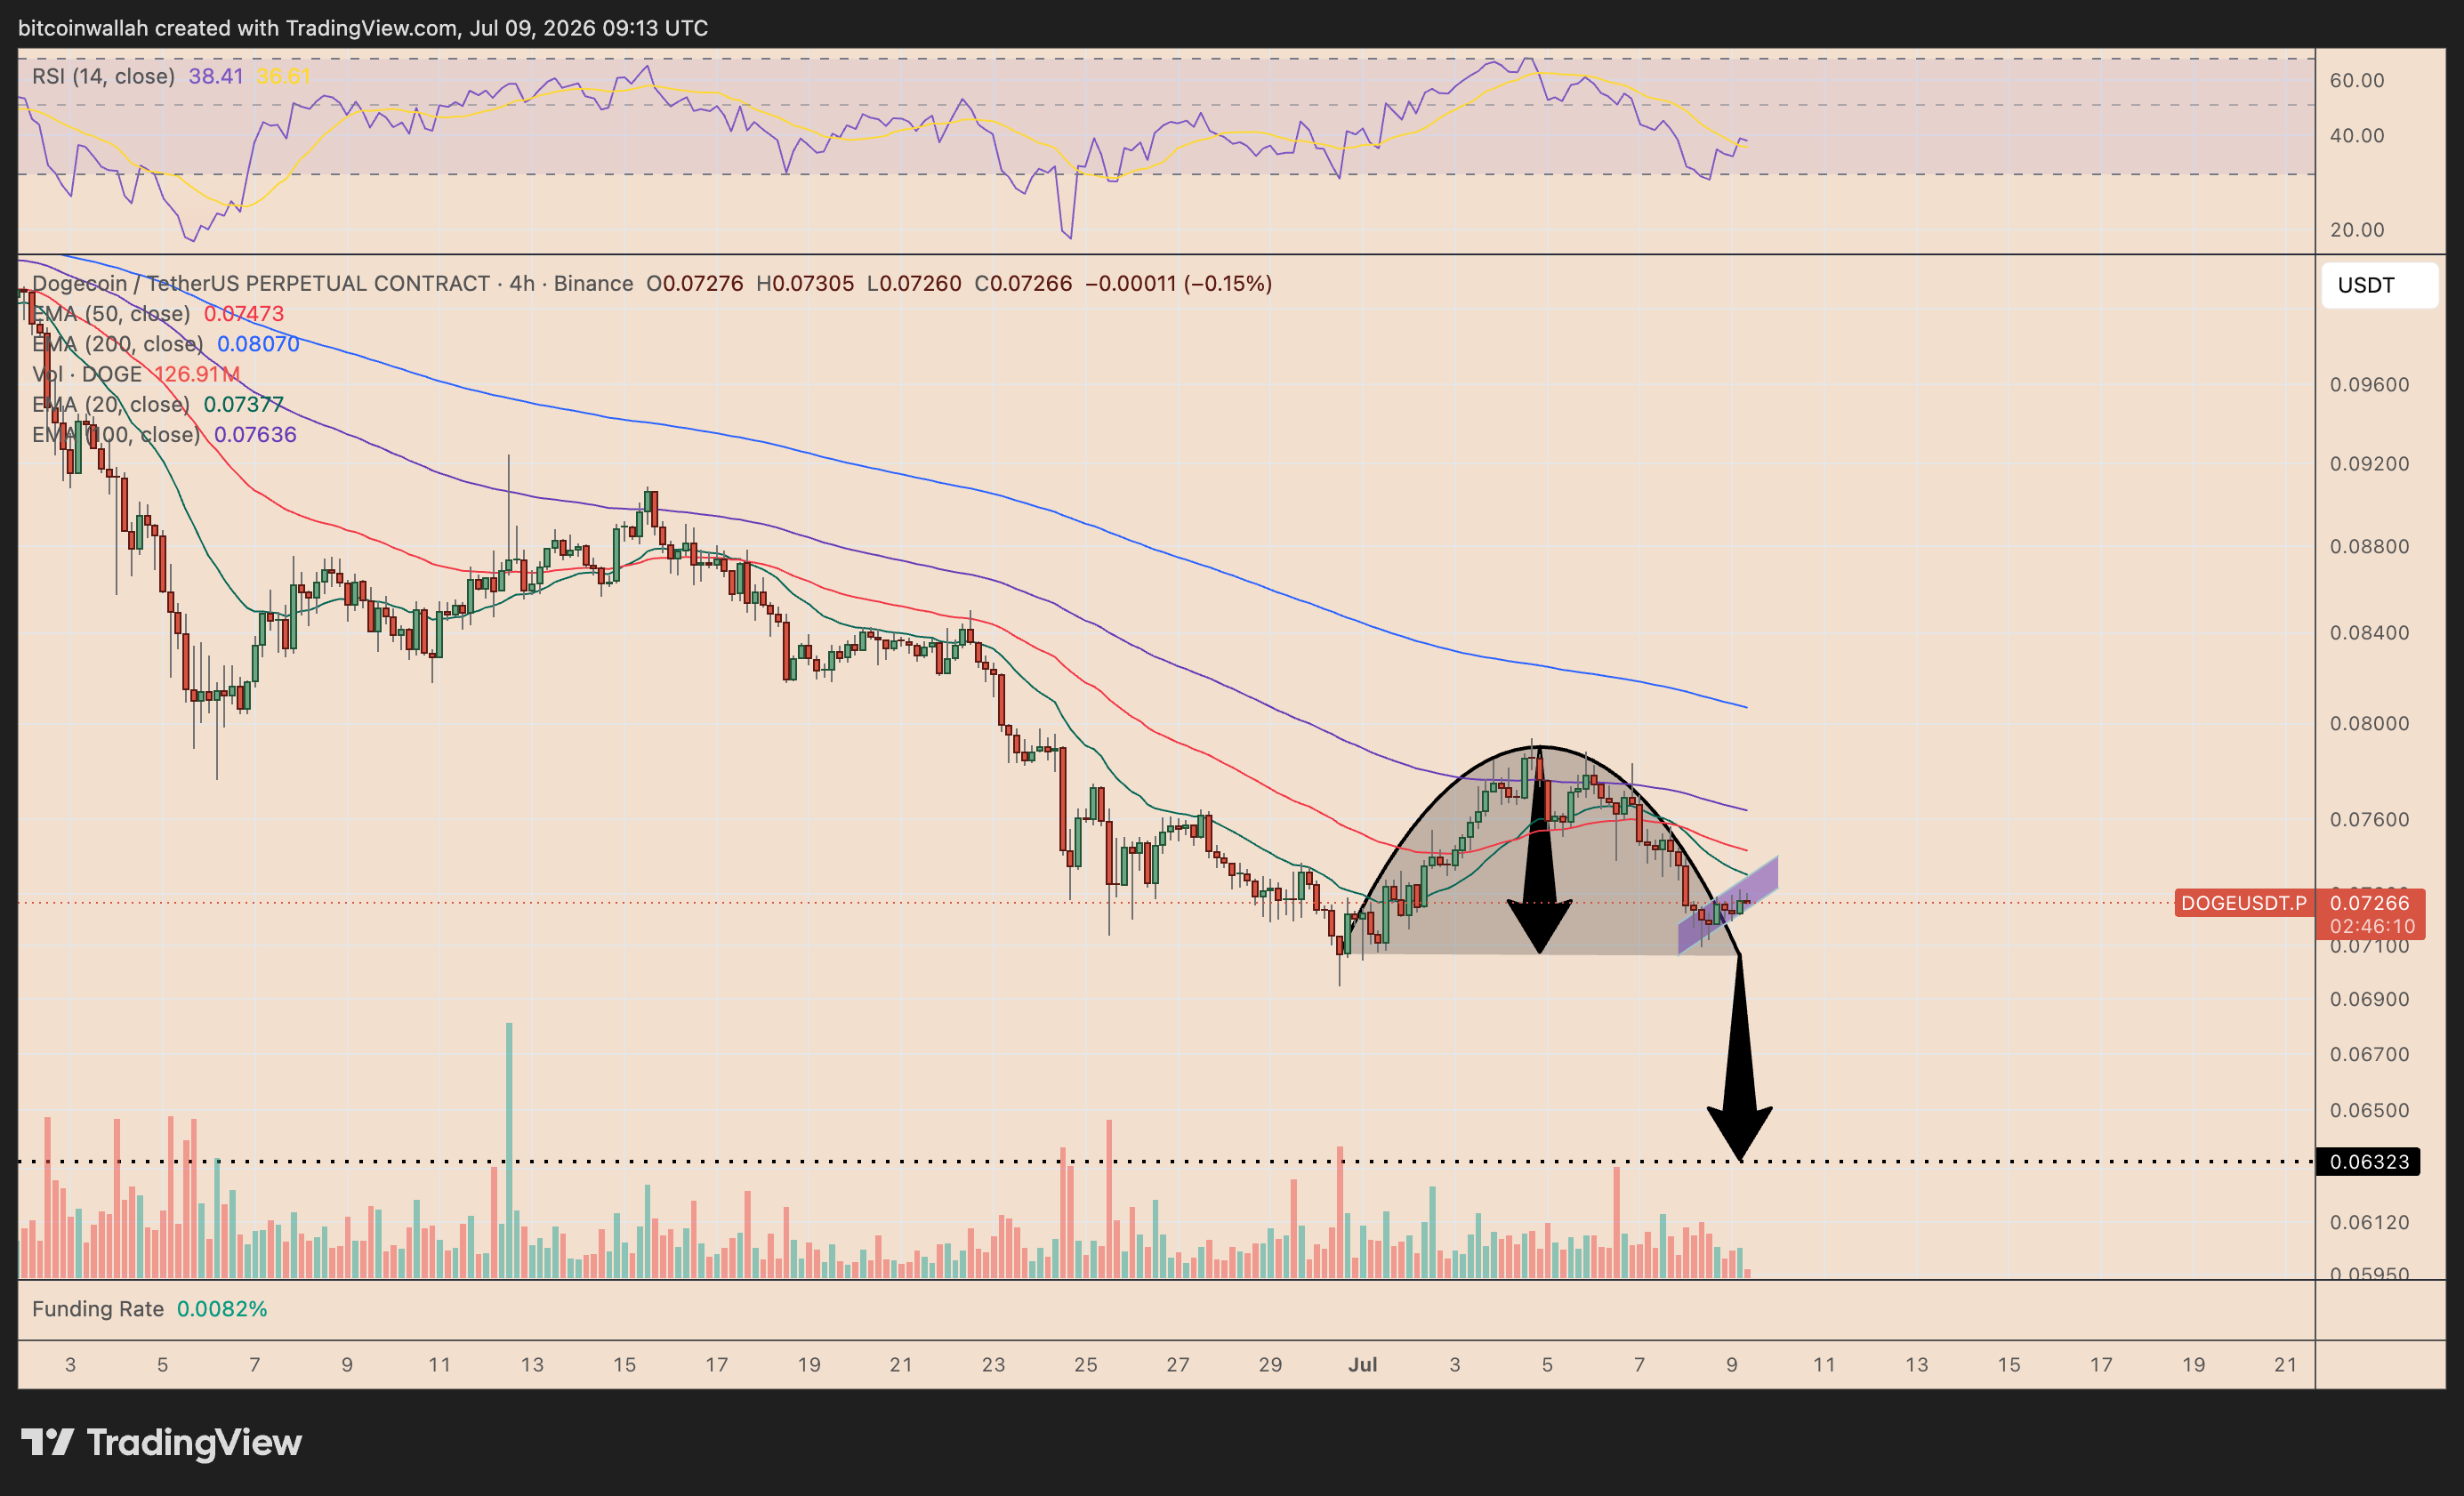
DOGE’s rounded top formed after its rebound from roughly $0.071 toward $0.079. The token has since returned to the $0.071–$0.072 support area and is now attempting a minor bounce near $0.073.
A decisive break below the pattern’s neckline near $0.071 could confirm the bearish setup. The pattern’s measured downside target sits near $0.063, or more than 10% below current prices.
DOGE also remains below its 20- (green), 50- (red), 100- (purple), and 200-period (blue) exponential moving averages, showing that bears still control the broader four-hour trend.
Its relative strength index (RSI) is around 38, leaving room for another leg lower before reaching oversold territory.
Dogecoin Price Forecast
Every new Dogecoin analysis as it publishes, today's technical signal and key levels, live price — on one page.
See all Dogecoin forecastsDogecoin MVRV Bands Point Toward the Same $0.06 Area
Dogecoin’s on-chain pricing bands also support the risk of a drop toward $0.06.
Glassnode‘s MVRV Extreme Deviation Pricing Bands compare DOGE’s market value with the average price at which its coins last moved on-chain. The model then creates price zones based on how far Dogecoin has moved above or below its long-term average.
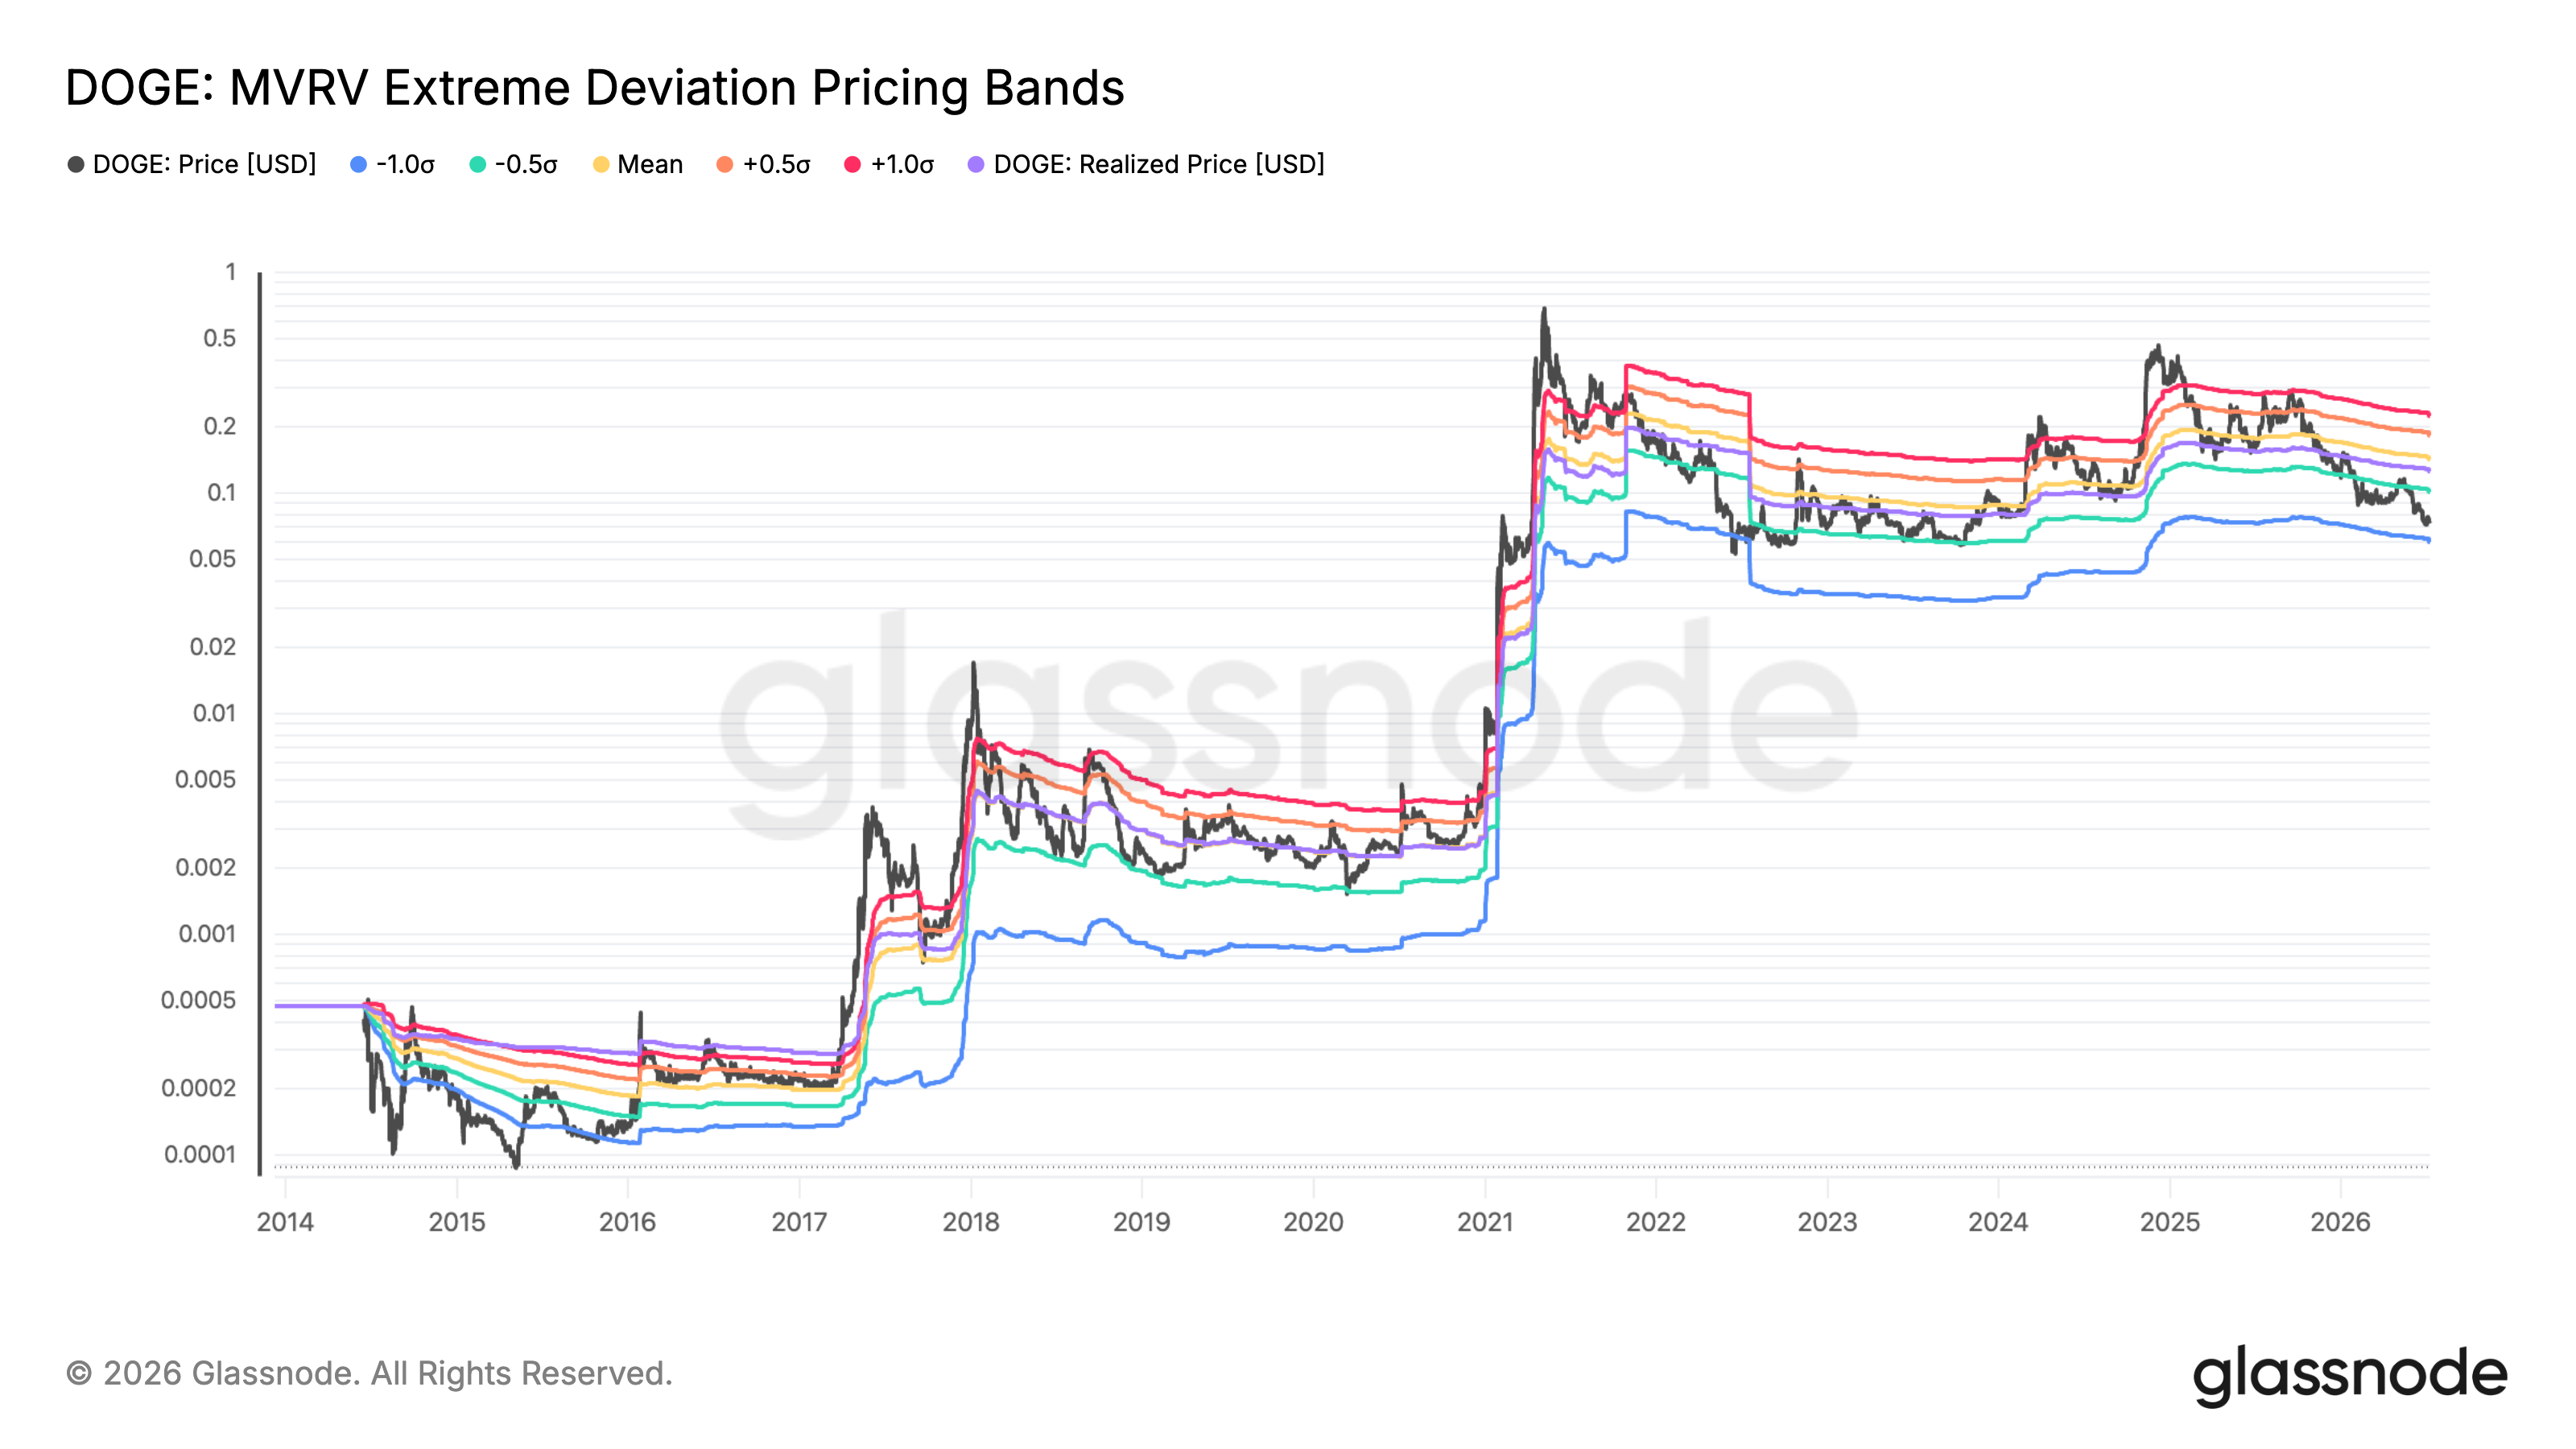
DOGE has already slipped below the green -0.5σ band and is moving closer to the blue -1.0σ zone near $0.06.
Put simply, Dogecoin is entering an historically depressed valuation area.
That does not guarantee an immediate price bottom. DOGE traded around its lower MVRV bands for extended periods during previous bear markets before a lasting recovery began.
However, the blue band near $0.06 closely matches the inverse cup-and-handle target of roughly $0.063. The overlap between the technical and on-chain targets strengthens the case for a possible test of the $0.06–$0.063 area.
US–Iran Attacks Fuel Oil, Inflation, And Fed Rate-Hike Fears
Dogecoin’s bearish setup comes as renewed military attacks between the US and Iran revive concerns about energy supplies through the Strait of Hormuz.
Fresh US strikes and Iranian retaliation initially sent oil prices sharply higher, with Brent briefly approaching $80 per barrel before paring some gains.
Higher oil prices could keep inflation elevated by increasing transportation and production costs, potentially giving the Federal Reserve fewer reasons to ease monetary policy.
That inflation risk has already contributed to a hawkish repricing in rate markets.
As of July 9, CME FedWatch data showed traders assigning a 50.8% probability to a 25-basis-point rate hike in September.
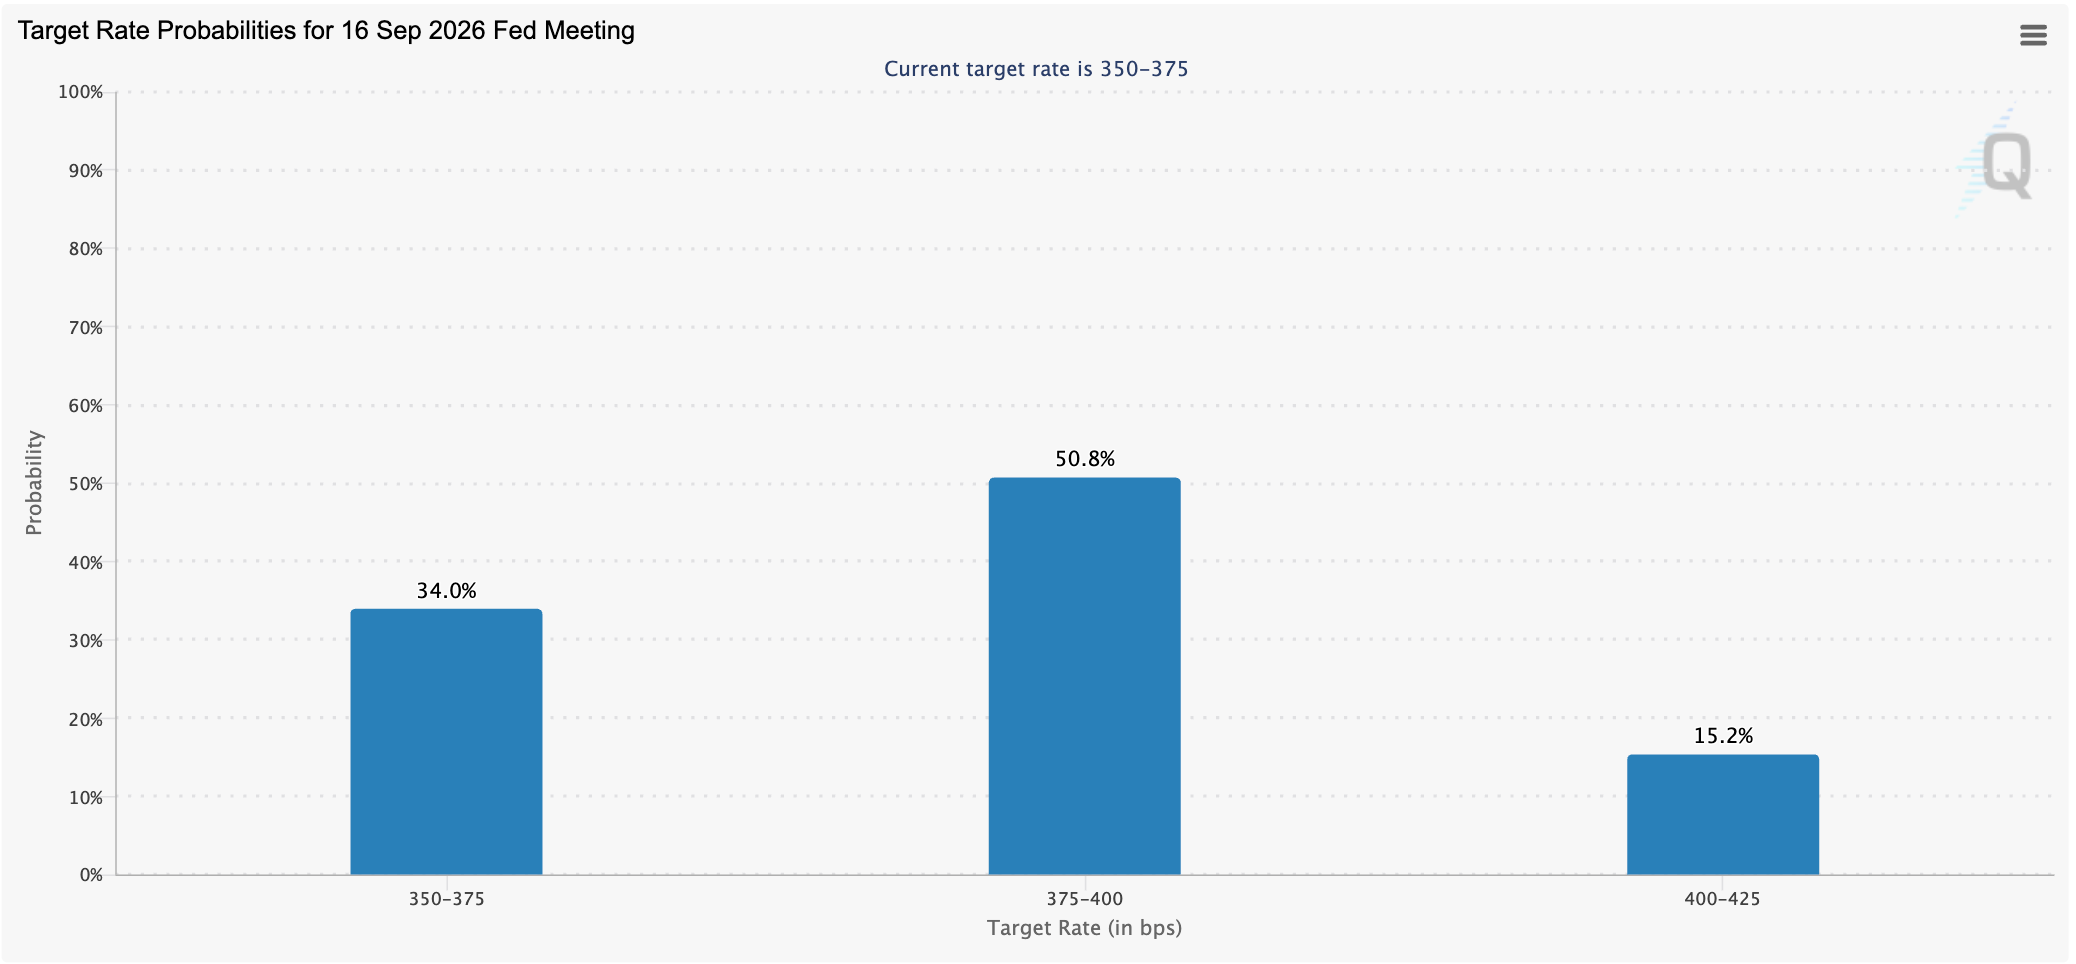
Including the odds of a larger increase, the combined probability of a September hike stood near 66%. CME says its FedWatch probabilities are derived from 30-day Fed Funds futures pricing.
For risk assets such as Dogecoin, a higher-for-longer interest rate outlook could add further selling pressure, strengthening the case for a decline toward $0.063.