
Currencies Assess FOMC Minutes Amid Policy Divergence
The U.S. dollar, the euro, and the pound are showing signs, as at the 9th day of July, that markets have processed new information released today by the FOMC minutes, on monetary policy discussions of the Federal Reserve concerning inflation, unemployment, and policy setting. Core price pressures were described as still being a concern in the FOMC minutes and supported a dollar that was expected to gain due to expected policy easing.
The European currency is facing growth heterogeneity within the euro zone and the European Central Bank’s pursuit of price stability. National budget disparities and divergent inflation rates across member states are creating a currency that is vulnerable to differences in growth, inflation rates, and monetary policy transmission.
The British currency has also been grappling with services inflation pressures and slower growth rates that the Bank of England has had to consider. Domestic budget spending and employment developments are crucial to the performance of the pound along with relative policy settings that can affect cross-rates with the U.S. and Europe.
Other factors, such as differential inflation paths, fiscal policies, economic growth levels, trade balances, and capital flows, can continue to drive currency valuations. As central banks respond to inflation pressures, their approaches will shape future developments in the FX markets. For now, the FOMC minutes released today, along with the upcoming data, provide additional market intelligence and could be a determining factor in shaping the trend that currencies are expected to move over the short term.

DXY Holds $100.85 – Fibonacci 0.618 Retest on 1D
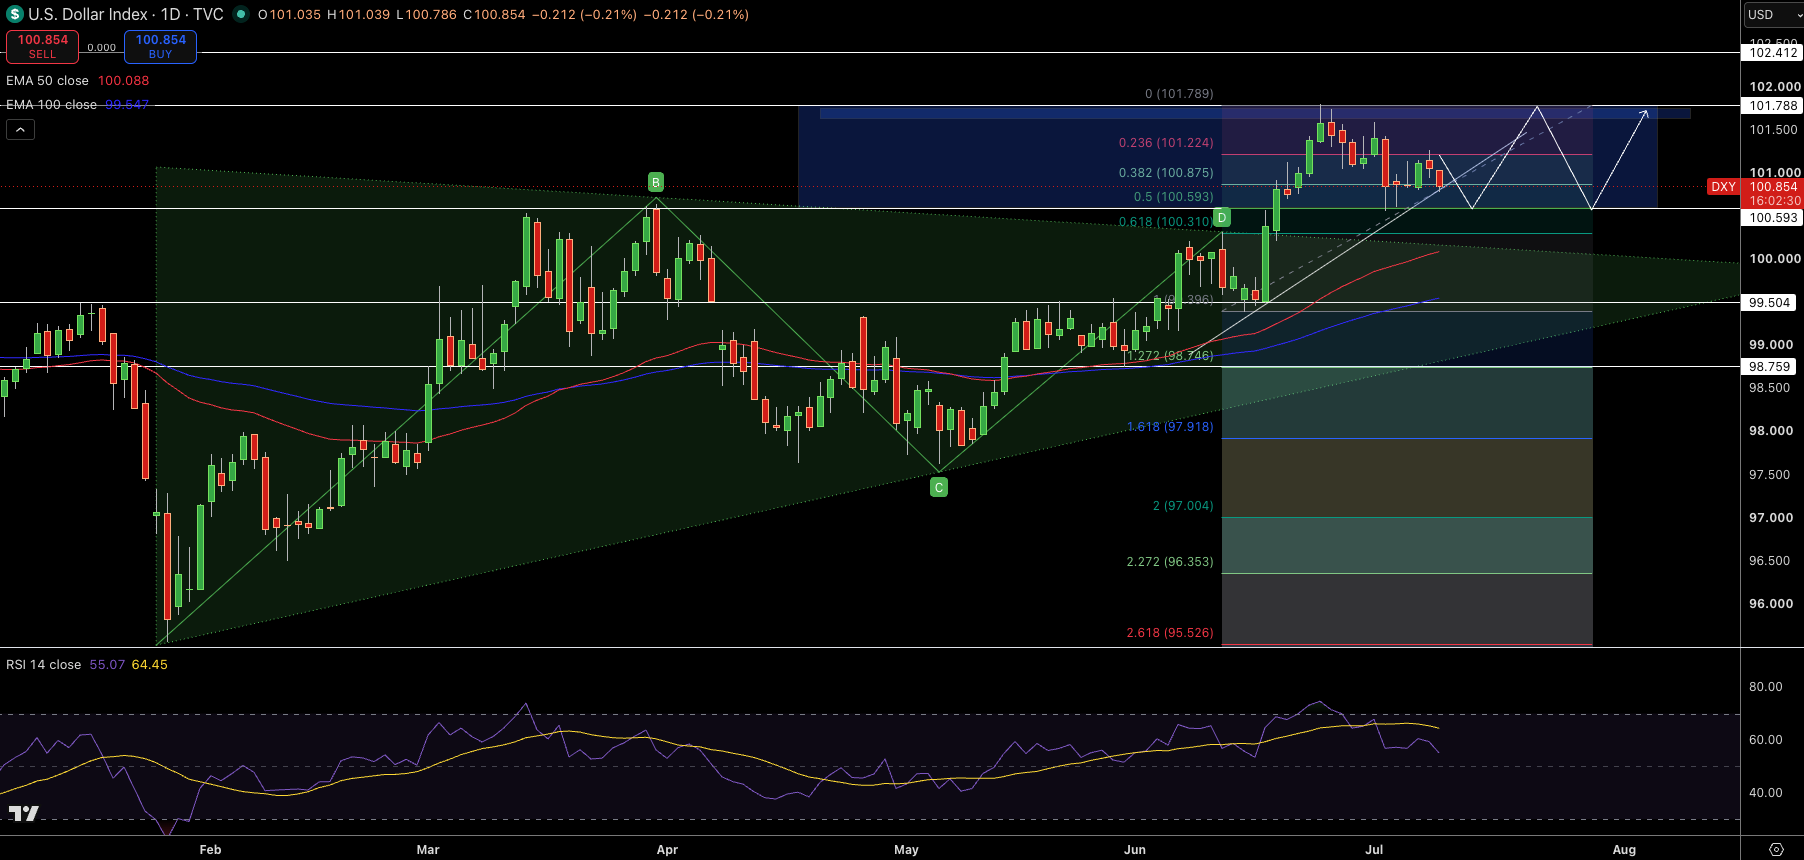
DXY maintains price at $100.85 after bouncing off the daily time-frame 0.618 Fib at $100.31 following the break-out of the $97.67 swing low. Mixed candles, with a tendency for green candles above red candles, are respecting the 50 EMA at $100.09 while producing higher highs. RSI is hovering around the 55 range. $100.31 is a clear breakout point based on the volume profile, and the next 0.618 target projection is at $103.09.
This price is likely to be tested in the next few weeks. DXY remains bullish above $100.31. The market is currently trading within an ascending channel that presents a structure of higher highs and higher lows. Buyers remain dominant above $100.31.
Trade Idea: Go long at $100.85, target $103.09, stop at $100.31.
GBP/USD Price Forecast
Every new GBP/USD analysis as it publishes, today's technical signal and key levels, live price — on one page.
See all GBP/USD forecastsGBP/USD Holds $1.3418 – White Descending Trendline Test on 2h
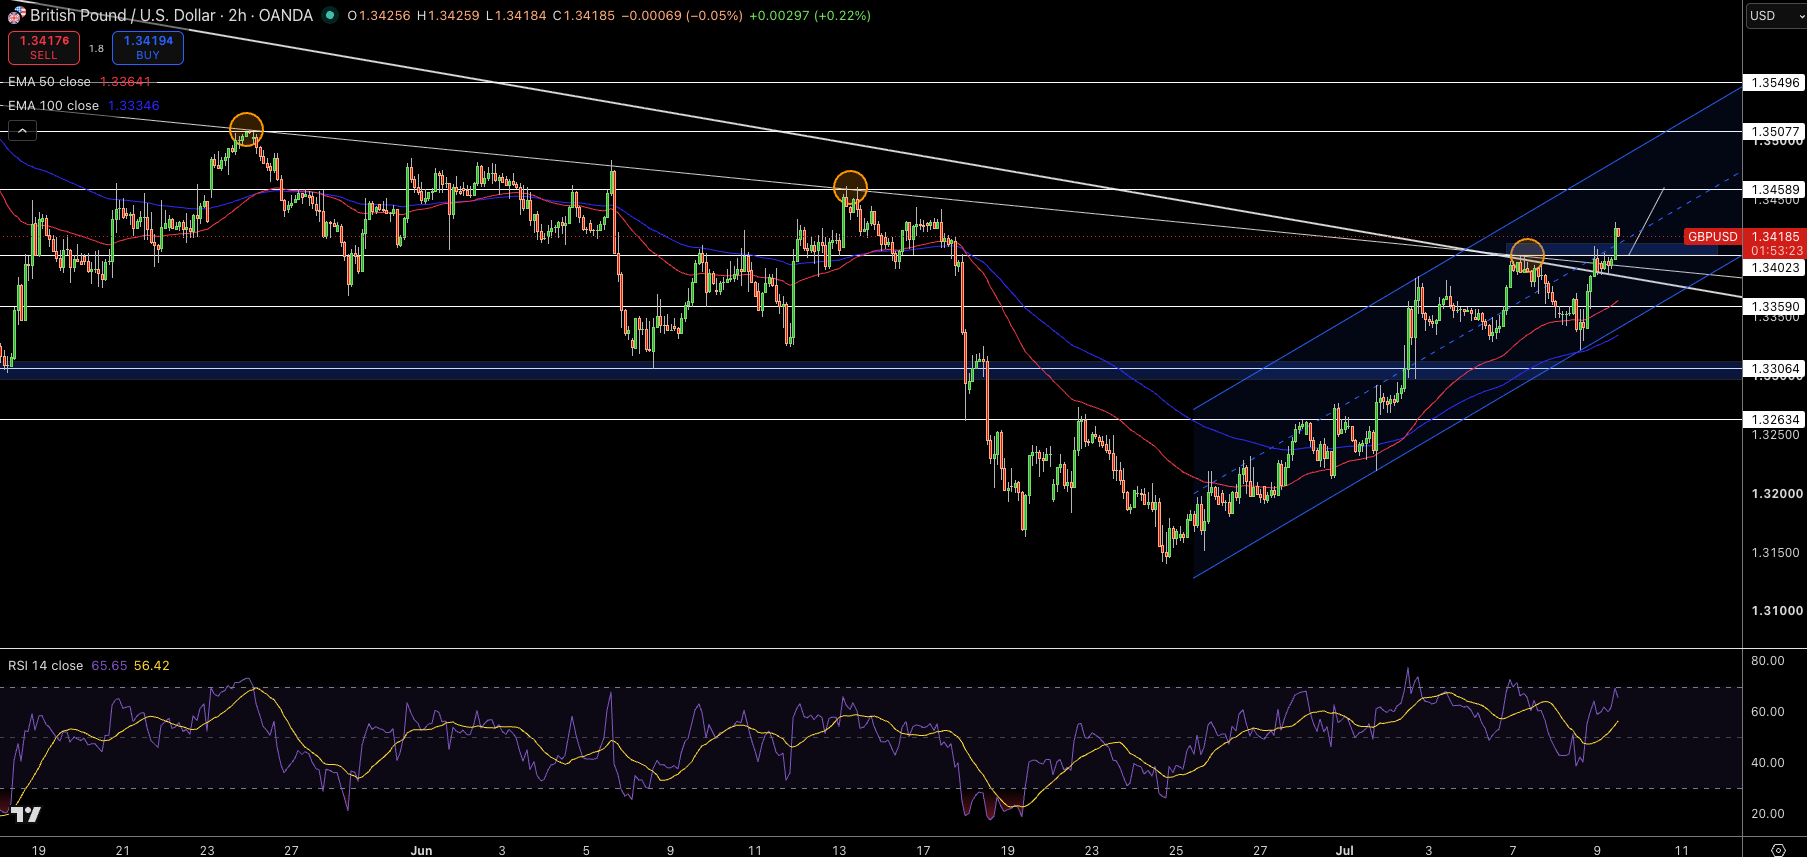
GBP/USD trades at $1.3418 on a 2H timeframe chart. Mixed candles are testing the descending trendline in white at $1.338 after the price was rejected from the red moving average at $1.337. The presence of green wick above red candles and higher highs indicates absorption at the resistance levels. RSI is hovering around 65. $1.331 to $1.338 is the clear cluster of pivot points based on the volume profile, and the next level of support is found around $1.325 to $1.331.
Overall, the market is neutral to bullish above the trendline within the range of trading. A pattern of higher highs is keeping buyers active at dips.
Trade Idea: Go long at $1.3418, target $1.345, stop at $1.325.
EUR/USD Holds $1.1440 – EMA 50 Defense on 2h
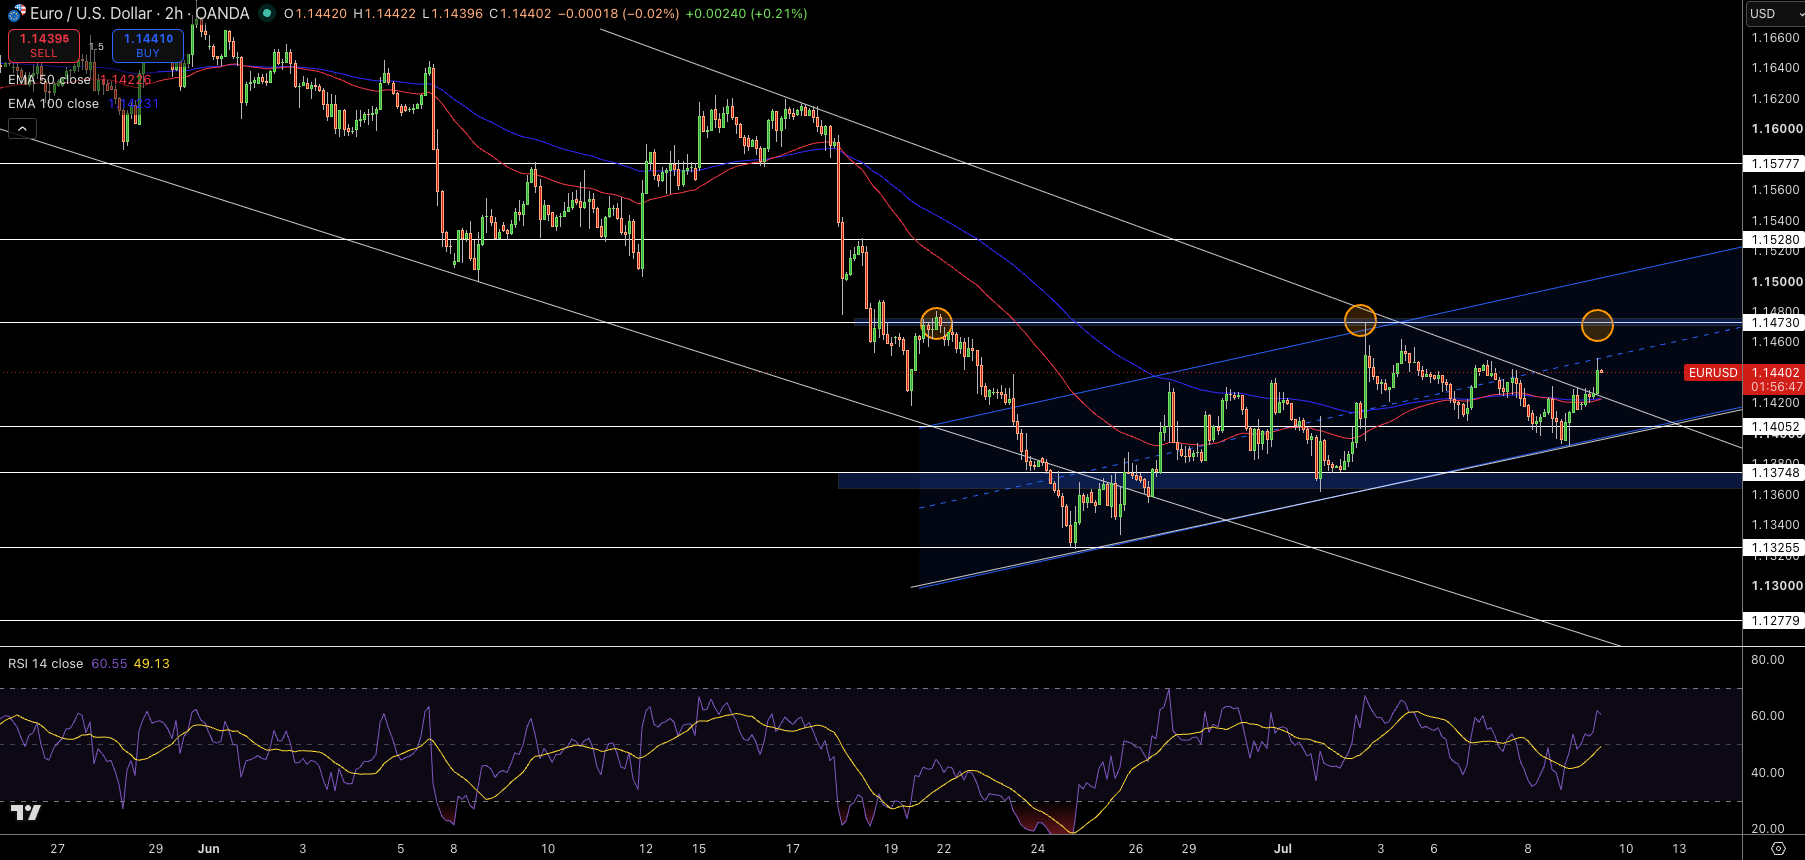
EUR/USD trades at $1.1440 on a 2H timeframe chart. Mixed candles are defending the 50 EMA at $1.1423 after the price was rejected from the red moving average at $1.162. The presence of green wick above red candles and higher lows indicates absorption at the support levels. RSI is hovering around 61. $1.140 to $1.150 is the clear cluster of pivot points based on the volume profile, and the next level of resistance is found around $1.155 to $1.162.
Overall, the market is neutral to bullish above the 50 EMA while remaining bearish in the long-term time frame. A pattern of higher lows is keeping buyers active at dips.
Trade Idea: Go long at $1.1440, target $1.155, stop at $1.140.