
Oil and Gas Fundamentals Reflect Supply Discipline and Seasonal Demand
Global oil markets as of July 9 continue to see OPEC+ production discipline counter-balanced by increased production outside OPEC+. Refinery utilization remains elevated as summer driving season continues and demand for fuels and petrochemicals remains elevated, and changes in supplies at key storage locations are roughly offset by changes in oil offtake. U.S. crude stocks in recent reports showed limited net changes as operating inventories at key locations are just above minimum operating levels. Refined products demand remains solid as economic activity and demand for fuels holds steady.
U.S. natural gas production continues to rise to new highs. Dry gas output is rising thanks to associated gas volumes as well as natural gas well output. LNG export facilities remain busy with strong overseas demand. The U.S. natural gas inventory is increasing into storage with working gas volumes above average levels. Power-sector demand varies with weather conditions, while industrial consumption provides a stable foundation. These dynamics suggest a plentifully supplied natural gas domestic and export market.

Natural Gas Futures Hold $3.212 – EMA 50 Defense on 2h
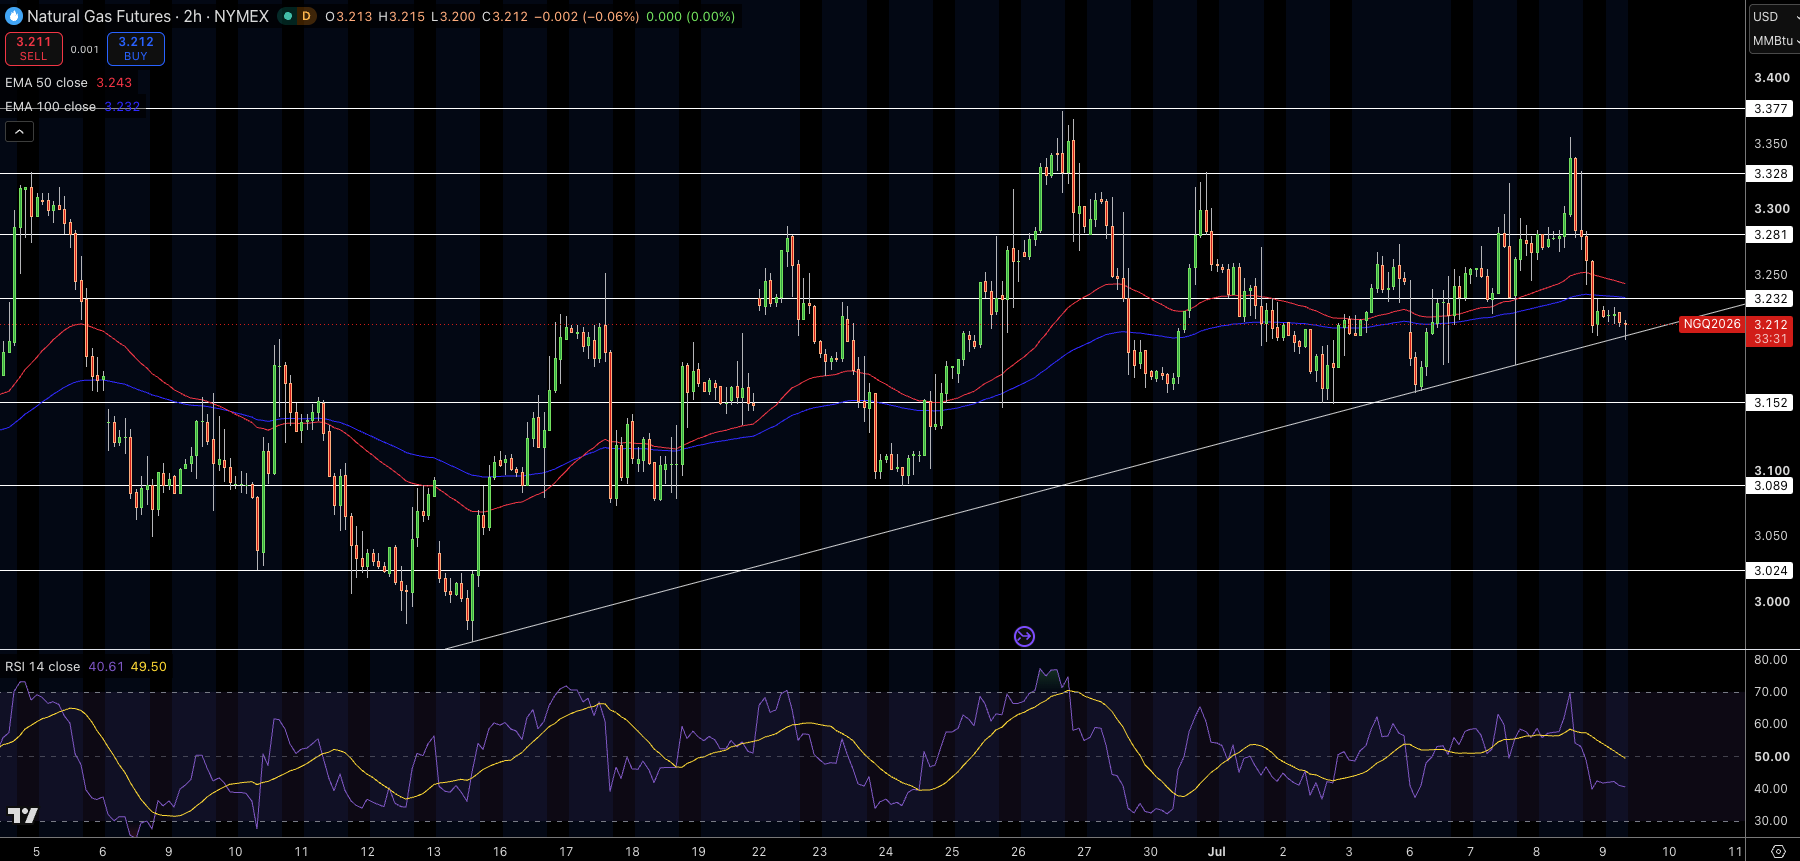
Natural gas futures are trading around $3.212 on the NYMEX 2-hour chart. After rejection at the EMA 100 around $3.222, alternating candles defended the EMA 50 at roughly $3.243. Bullish candle lower wicks from the swing low of $3.099 indicate buyer control during pullbacks. The RSI is sitting at 40 indicating a neutral momentum.
The $3.12 zone from the volume profile shows a support pivot point. We can expect to see resistance from around $3.229 to $3.260 from the Fibonacci extension. The structure remains neutral above $3.099 while testing the EMA cluster. Higher lows continue to hold buyers on the long side during pullbacks.
Trade Idea: Trade long entry $3.212, price target $3.260, stop $3.12.
WTI Crude Oil Holds $73.85 – Fibonacci 0.236 Retest on 1D
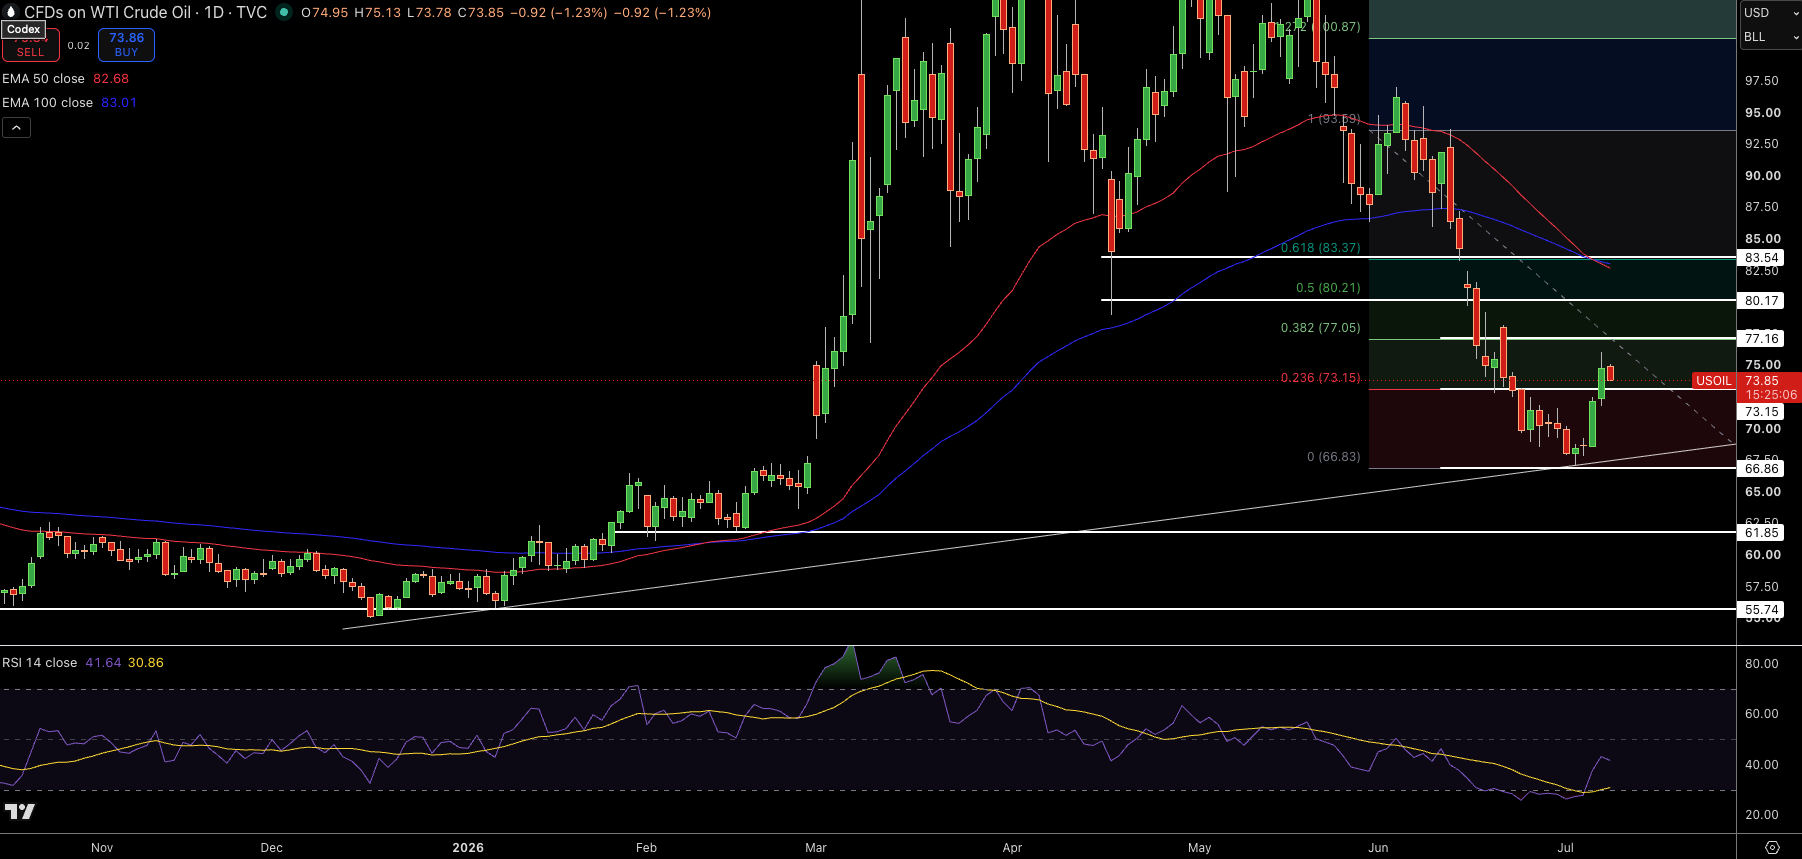
WTI is trading around $73.85. After a rapid drop from the $93.59 high, alternating green and red candle bodies tested the 0.236 Fibonacci level at roughly $73.15. Bearish candles making new lower highs and maintaining the price below the EMA 50 at around $82.68 are telling us distribution. The RSI is sitting at 42 indicating a neutral momentum.
Natural Gas Price Forecast
Every new Natural Gas analysis as it publishes, today's technical signal and key levels, live price — on one page.
See all Natural Gas forecastsThe $73.15 to $77.05 zone from the volume profile shows us support. We can expect to see resistance from around $80.21 to $83.37. Below $77.16 the overall pattern is neutral to bearish, within the bigger downtrend from the $110.00 high. Lower highs continue to keep sellers engaged on rallies.
Trade Idea: Trade short entry $73.85, price target $66.83, stop $77.05.
Brent Crude Oil Holds $78.33 – Blue Descending Channel Floor on 2h
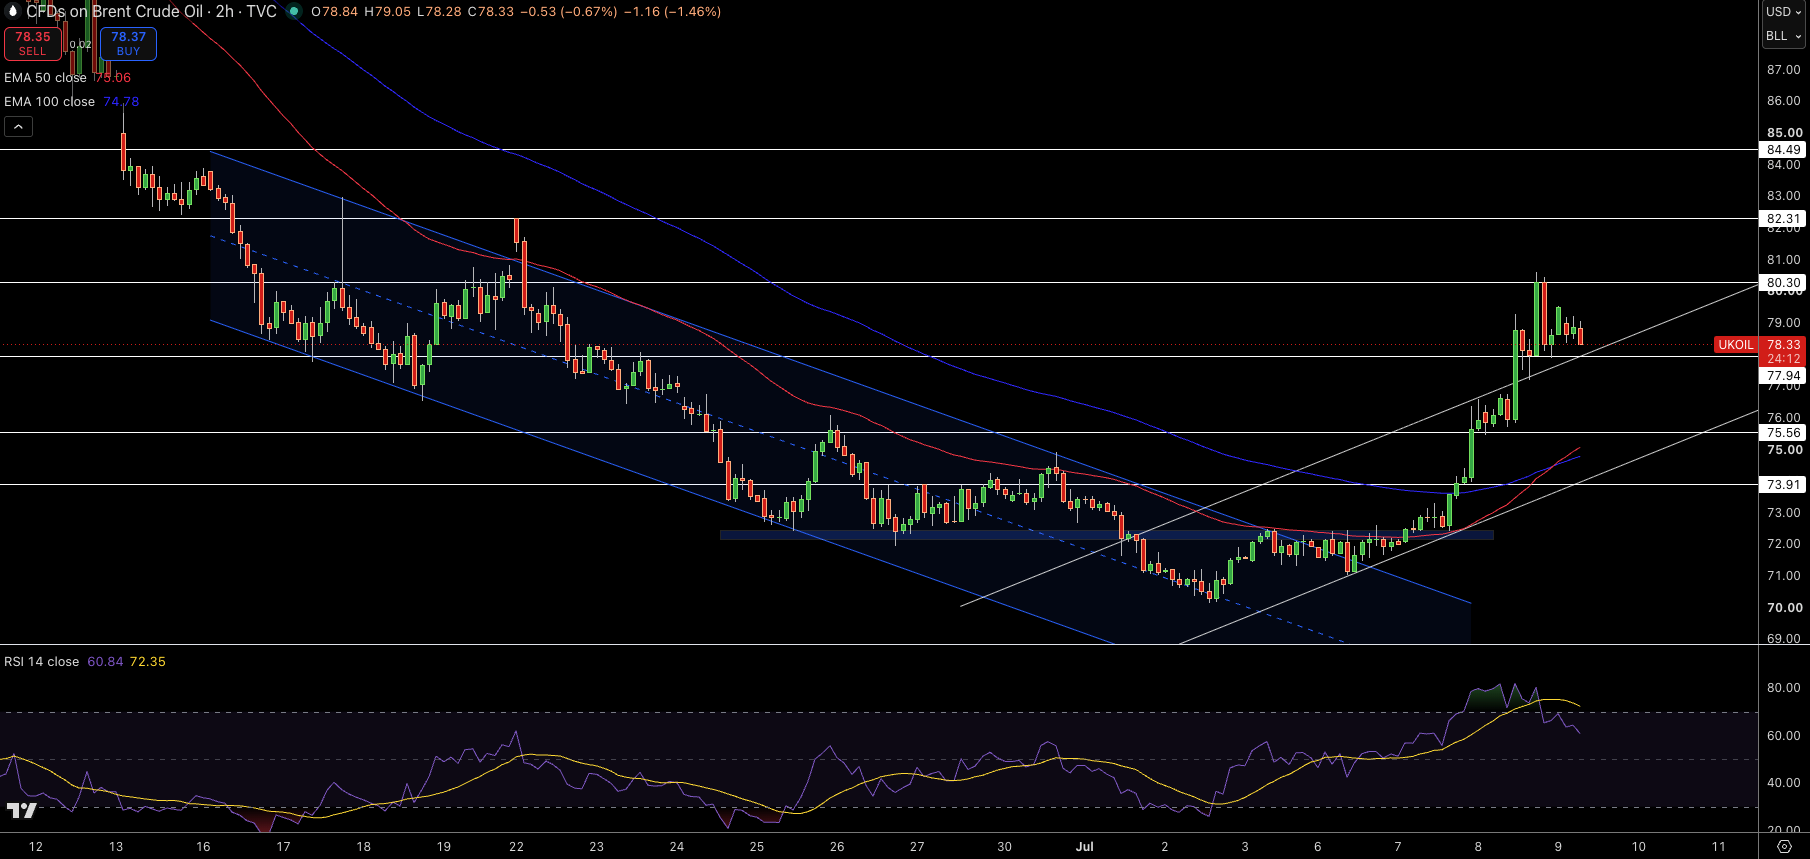
Brent is trading around $78.33. After rejection at the red MA around $78.27, alternating green and red candle bodies tested the blue floor of the descending channel at around $77.94. The bullish lower wick indicates buyer absorption at support, followed by a lack of bearish follow-through. The RSI is sitting at 61 indicating a neutral to bullish momentum.
The $78.00 to $79.00 zone from the volume profile shows an emerging fair value area. We can expect to see resistance from around $80.30 to $82.31. Above the blue floor of the descending channel the overall pattern is neutral to bullish, within the bigger downtrend. Higher lows continue to hold buyers on the long side during dips. Trade long entry $78.33, price target $80.30, stop $77.94.
Trade Idea: Trade long entry $78.33, price target $80.30, stop $77.94.