


Resistance Rejection Strengthens Bearish Trend
Gold fell to a five-day low of $4,022 on Wednesday after once again being rejected from resistance near the converging uptrend line and 20-day moving average. A lower swing high of $4,203 was established, reinforcing the near-term downtrend and increasing the likelihood of bearish continuation. As long as gold remains below these resistance levels, further downward pressure is likely, with support near the trend low of $3,942 remaining vulnerable to another test.
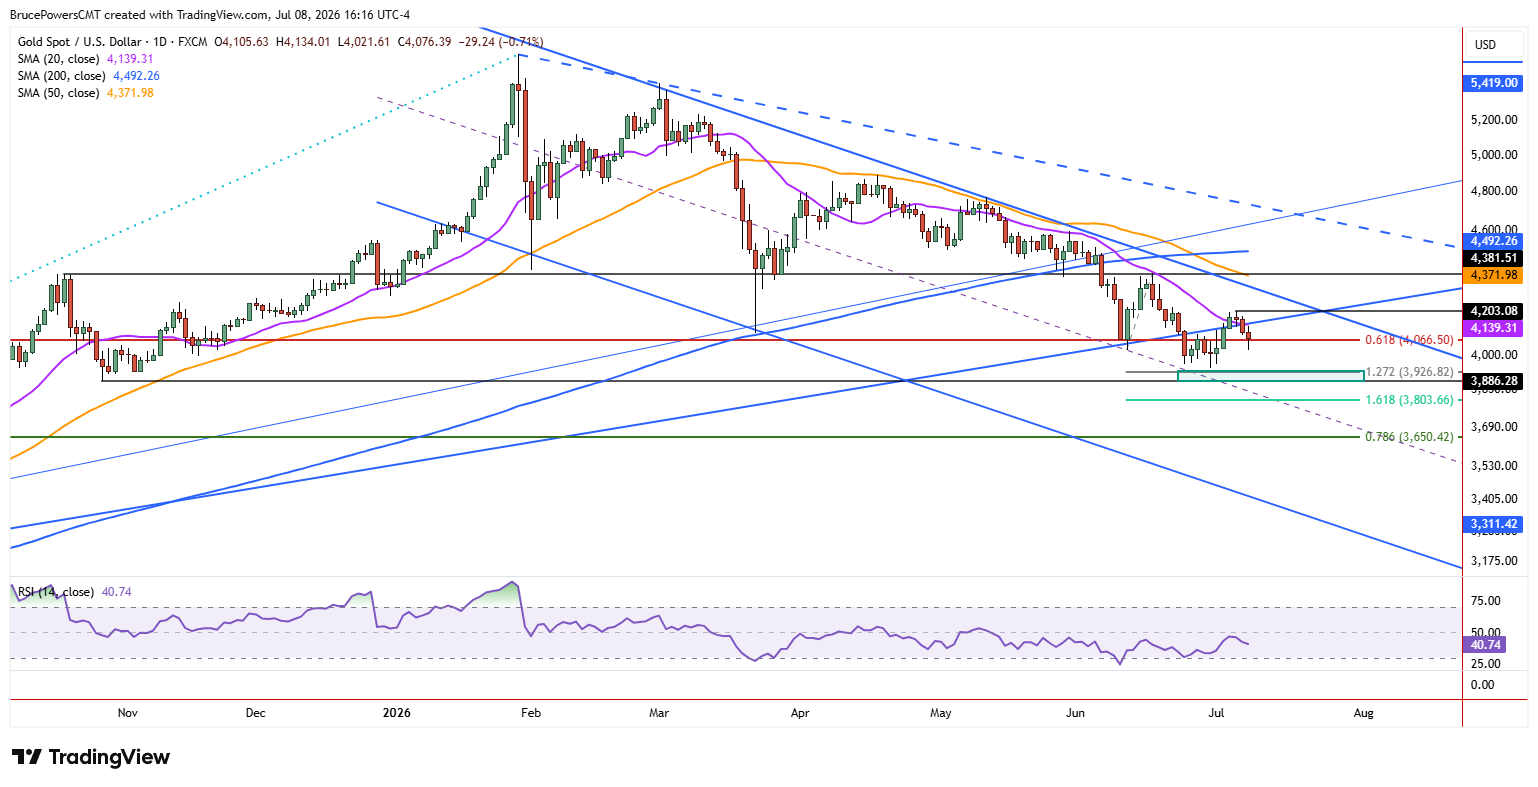
Wednesday’s bearish price action confirmed a successful test of resistance near both trend indicators. The 20-day moving average has marked dynamic resistance several times during recent upswings, and its latest rejection reinforces the significance of the nearby uptrend line, which previously acted as support. Together, they now define a key resistance zone that sellers continue to defend.

Lower Support Zone Remains in Focus
Once this pullback is complete, the implications from last week’s long-term bearish signal could reassert themselves. The lower swing high confirms a bearish trend structure, and the downtrend is expected to continue until there are signs to the contrary. Given the current price structure, a sustained reclaim of the 20-day moving average would provide the first confirmation of improving momentum. Subsequently, a bullish reversal signal in the trend structure would trigger above the new lower swing high of $4,203.
Despite the bounce from the recent trend low, which indicates at least short-term support, a lower support target zone remains nearby could still be tested. It is defined by a range from approximately $3,927 to $3,886, and the entire range should be viewed as a potential support zone rather than a single price level. If it fails to generate buying interest and lead to a sustained advance, the next lower target is the 161.8% Fibonacci extension of the prior upswing at $3,804.
Weekly Chart Keeps Broader Bearish Outlook Intact
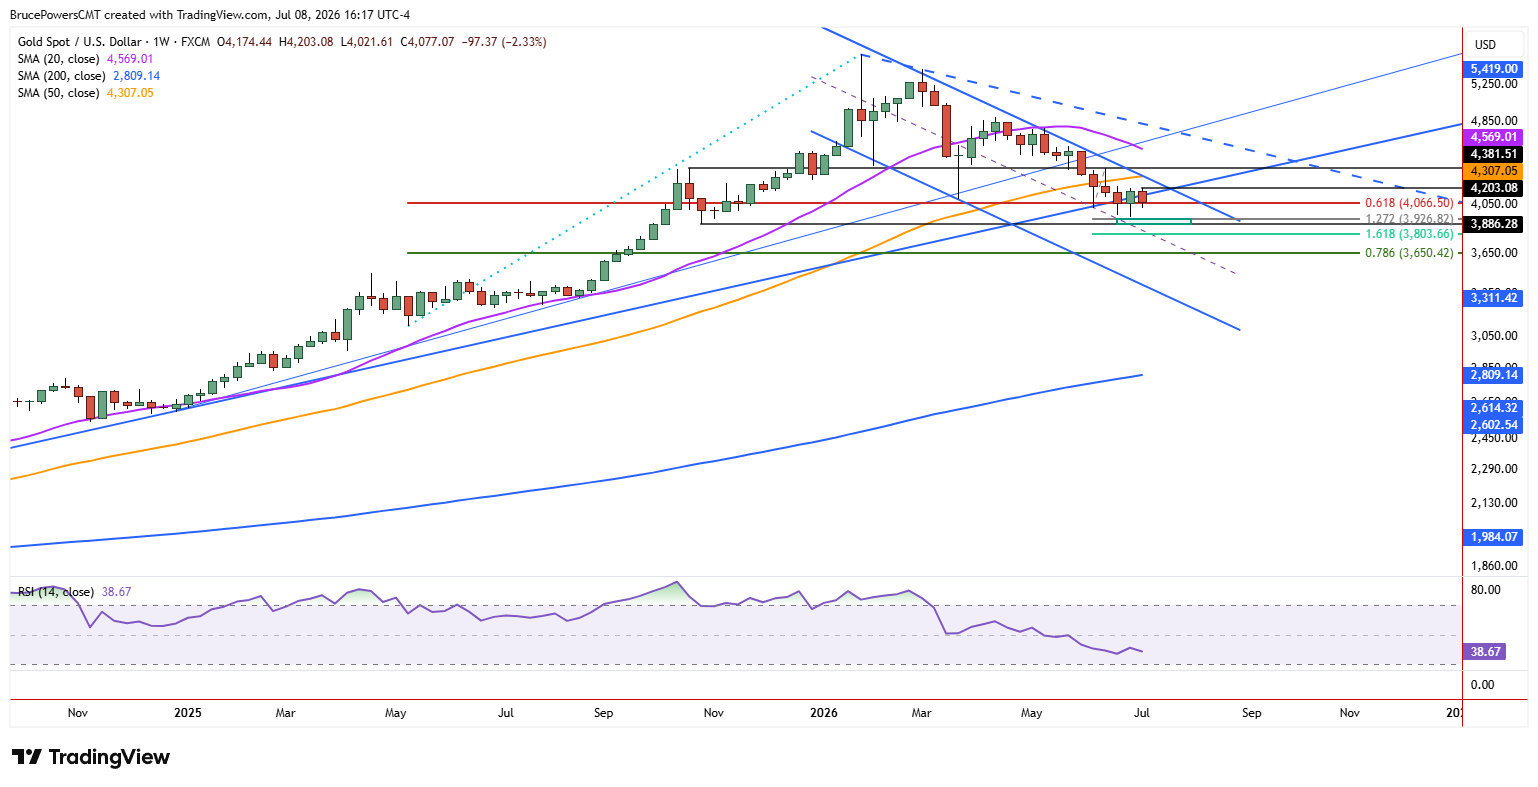
The weekly chart shows a steady decline following the $4,891 swing high in mid-April. On Monday, a weekly bullish reversal signal triggered above $4,195, but it failed to gain confirmation with a daily close above that level. That leaves the signal unconfirmed and keeps the broader bearish outlook intact. Another weekly breakout attempt remains possible, but unless buyers reclaim resistance, the recent rejection from the converging uptrend line and 20-day moving average continues to favor additional downside pressure into support.
If you’d like to know more about how to trade gold and silver, please visit our educational area.


